


How The Market Gets Interest Rate Predictions Wrong
South State Correspondent
APRIL 22, 2024
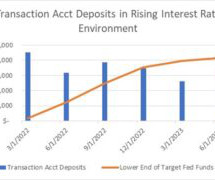
Below is a graph of short-term rates, and their historical levels in the blue line and forecasts of those same rates in the dotted red line at various times in history. Below is a graph of short-term rates, and their historical levels in the blue line and forecasts of those same rates in the dotted red line at various times in history.


Let's personalize your content