Remove data-visuals
article thumbnail

Data Visualization and the Art of Storytelling

Perficient

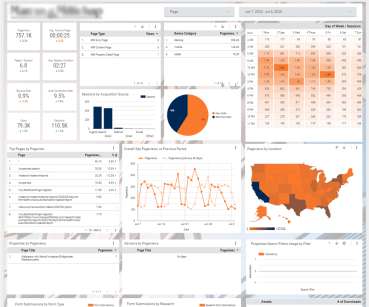
One solution for this is using an eye more to visualize information. These characteristics also works with data visualization. So a person visualizing data is more of a story teller using his technical skills to narrate a story about data using different visualization tool. Understand your audience.

Data 322
article thumbnail

How FinTechs Enable Payment Data Visualizations

PYMNTS

Elasticsearch is an open-source data store “that you can put tons and tons of data in” and it’s very robust, DadeSystems CTO and Co-Founder Doug Hathaway told PYMNTS in an interview. Kibana, on the other hand, is the data visualization tool that’s built on top of Elasticsearch.

Fintech 131
Insiders

Sign Up for our Newsletter

This site is protected by reCAPTCHA and the Google Privacy Policy and Terms of Service apply.

article thumbnail

Improving ROA and Data Visualization At Your Bank

South State Correspondent

THE DATA ON NIM Data visualization is the presentation of data in a pictorial or graphical format. It enables decision-makers to see analytics more easily, grasp difficult concepts, identify new patterns, and explain outliers.

Data 150
article thumbnail

Data and Dashboards: A Visual Approach to Information

Perficient

Many companies are faced with a problem – how to see the data that is most relevant to their business to gather insights. A recent client needed a way to see and show leadership relevant, high-level data that was most important to the business. Next, I began to divide the data into types: out-of-the-box and custom.

Data 322
article thumbnail

Pass Microsoft Certified Power BI Data Analyst Exam | PL-300

Perficient

About the Exam : PL-300: Microsoft Power BI Data Analyst. Analyzing Data with Microsoft Power BI (PL-300) is the requirement for Microsoft Data Analyst Associate Certification. Power BI is one of the most used Business Intelligence and Data Visualization tools. Syllabus: Prepare the data (15-20%).

article thumbnail

My Experiences with Live Connection Mode: Power BI

Perficient

Live Connection is one of the connection modes to connect the data source into Power BI, just like Import and Direct Query. As of now, some of the cloud data sources we can connect through Power BI Live Connection are: Azure Analysis Services. Open a Power BI Desktop, click Get Data, and select Analysis Services.

Analysis 332
article thumbnail

Making Meaningful Data Reports with Microsoft Power BI

Perficient

Create Power BI r eports to effectively translate your business data . Microsoft’s Power BI is a versatile platform that allows users to connect to and transform data to make meaningful and interactive visualizations. Using Dataverse as a data source also eases security concerns.

Report 393