Cost-cutting is back in vogue as banks of all sizes contend with subdued growth. Marketing tends to get the gimlet eye of senior management early on — even though cuts there sometimes resemble a fisherman who economizes by using bare hooks to save money on bait.
“Many of our clients are being asked to reevaluate their marketing budgets for 2024,” says Ally Akins, a consultant at Capital Performance Group. “They are being asked to project the return they’re going to get from each marketing activity, which is something they haven’t been asked to do before.”
As the budget battles heat up, The Financial Brand partnered with CPG on a project meant to offer some insight into the level of marketing spending across financial institutions nationwide.
This second round of analysis focuses on banks with under $2 billion of assets as of yearend 2022, and the results are especially helpful for those making a case to invest in marketing.
The first installment of this series covers banks with $2 billion to $10 billion of assets.
The Dynamics Putting Pressure on Marketing Budgets
The challenge facing marketers at community banks can be simplified into one question: What spending will drive the needle next year?
And the “needle” is no longer loan growth — which has dominated the attention of the banking industry for years.
“It’s all about deposits now,” says Claude Hanley, a partner at CPG. “All of our clients are strapped for liquidity.”
High interest rates have made deposits — the fuel for loan growth — more expensive and harder to come by. “Many can’t grow their loan book because they can’t fund it,” Hanley says.
Though high rates also are dampening loan demand compared to past years, Hanley says many bankers are seeing lending opportunities and would be doing more if they could. “They feel the demand is there, but they don’t have the deposits,” he says.
Deposit runoff has slowed down from where it was in the wake of the spring banking crisis. But there’s still a hole left behind, despite the heavy emphasis on deposit-raising, according to Akins.
The analysis from Hanley and Akins indicates that banks with under $2 billion of assets that have spent more on marketing typically have seen better results than their peers on some key metrics, though.
Their analysis draws on data from the Federal Deposit Insurance Corp., with the annual “advertising and marketing expenses” item in call reports being key. Not every marketing expense gets rolled up into this line item. Salaries, for example, appear elsewhere.
But the data is a valuable proxy and provides a basis for measuring spending against performance and assessing trends.
About the study:
CPG analyzed data for 2,966 banks nationwide that had assets under $2 billion as of yearend 2022. The group excludes those that acquired another bank in the three-year period covered by the study (2020, 2021 and 2022).
Of the 2,966 banks, 843 — or 28% — reported their advertising and marketing expenses to regulators. A bank is required to submit information for this line item in the yearend call report when its advertising and marketing expenditures total $100,000 or more and when these expenses exceed 7% of its total “other noninterest expenses.”
The “reporting banks” are, by definition, investing more in marketing than those that don’t report marketing expenses.
The 3-Year Trend at Banks with Under $2 Billion of Assets
Looking at only those banks that reported their marketing spending is telling.
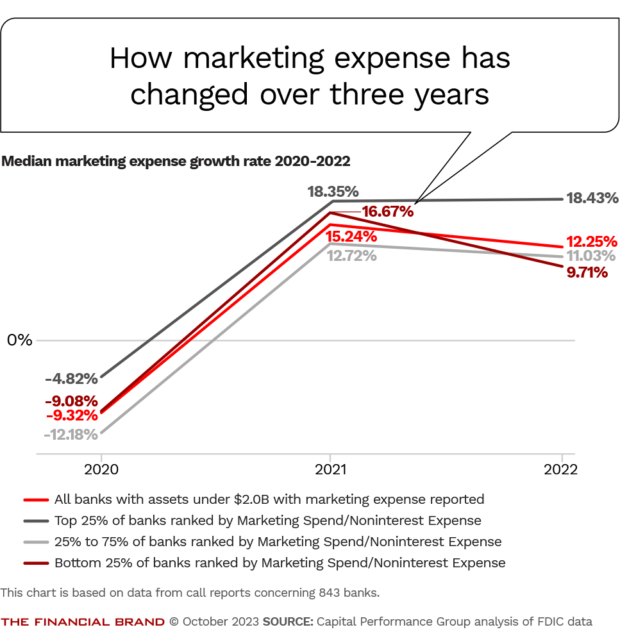
We ranked all 843 reporting banks by the ratio of marketing expenses to noninterest expenses for 2022 and divided them into three categories: the 25% that are the top spenders on marketing and the 25% that are the lowest spenders, with the remaining 50% in the middle.
The spending trends are directionally the same for each group in 2020 and 2021, but diverged in 2022, as the chart below illustrates.
In 2020 — a year when marketing largely went dark amid the pandemic — the median “growth” rates in spending were negative for the overall group and for each of the three categories. In 2021, the median rose significantly across the board.
In 2022, the median fell for the overall group and for two of the categories.
However, the median for the top 25% rose slightly. Notably, this same group also did less cutting in 2020 and upped spending more than their peers in 2021. Yet they still continued to increase spending proportionally higher than their peers in 2022.
This ratio represents how heavy a bank’s commitment to marketing is. Hanley points out the average asset size of the top-spending 25% was much smaller than that of the other reporting banks. Generally speaking, smaller banks are under greater pressure to grow to improve efficiency.
The group of top spenders averaged $581.3 million in assets versus $626.4 million for all reporting banks. The lowest-spending group averaged more than $700 million in assets — a size advantage of 20% when compared with the top spenders.
“So you can see that marketing spending isn’t necessarily directly tied to how big you are,” says Hanley. “Asset size is an incredibly crude proxy for a lot of things, including measuring the level of sophistication of a management team.”
Conversely, the study also found that the banks reporting marketing expenses are, on average, significantly larger than those that don’t report this data. The size difference there is 59%.
Read more: 4 Banking CMOs on What’s Working for Them Now
The Level of Investment in Marketing at Community Banks
To temper the data in the chart above — which is based on the growth rate of marketing expenses — it’s necessary to look at the actual ratio of marketing expenses to noninterest expense. This adds context to the level of investment in marketing.
Beyond showing the pattern among all reporting banks across the three years, the chart below includes the median ratio for banks in each spending category — the top 25%, the bottom 25% and those in the middle.
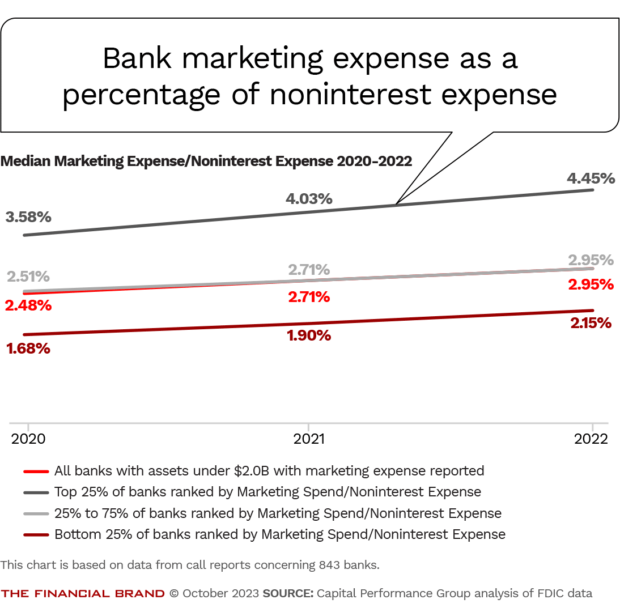
The sustained strength in spending for the top 25% suggests the leaders on the marketing team have a good working relationship with the rest of the executive team, Hanley says. “I would imagine that where you have a strong chief marketing officer, marketing has a greater voice at the table and is able to educate the rest of the team on the importance of marketing,” he says.
Perhaps these marketing believers won’t level off, or chop, in 2024.
After all, even the banks inclined to maintain a level marketing budget will find themselves in the same predicament as many wage earners do. Everything a marketing department does costs more — whether digital ad placements, website search engine optimization, or postage. So “level” can still feel like a budget cut.
Read more: How CMOs Can Maximize Their Marketing Budgets & Prevent Cuts
Growth in Loans and Deposits at Banks Reporting Marketing Expenses
CPG found that it’s difficult to correlate marketing spending with profitability. That’s because there are too many variables affecting profitability — from compliance costs to loan-loss allowances — that are beyond the purview of marketing. But marketing spending can, to borrow a phrase from Akins, “drive the needle” in other ways.
In the table immediately below, the 2,966 banks with less than $2 billion of assets are measured against the subgroup of banks that reported marketing expenses and the subgroup of banks that did not report marketing expenses.
Looking at the performance of banks with under $2 billion of assets that reported marketing spending and those that didn’t
As mentioned earlier, the reporting banks are, by definition, spending more on marketing than those that didn’t meet the regulatory thresholds for submitting this data.
So it’s notable that, for 2022, the reporting banks had higher median growth in loans (13.36%) and demand deposits (3.67%) year over year when compared with their non-reporting peers in this size range. The reporting banks also had a higher median loan-to-deposit ratio (79.05%).
The banks that can keep their marketing edge honed sufficiently to retain a greater share of noninterest-bearing deposits than rivals will have an advantage.
Recent industry trends underscore this, including those outlined in an October report from S&P Global Market Intelligence.
The report showed that deposit outflows slowed industrywide in the second quarter. However, the deposit mix has been changing. Interest-bearing deposits “rose modestly” in the first six months of 2023, but noninterest-bearing deposits fell by 12% in the same period.
The noninterest-bearing deposits, which made up 26.1% of total deposits at yearend 2022, fell to 23.6% in the first half. S&P Global projects that the percentage will fall further to 21.5% by the end of 2023, and further still, to 19%, by the end of 2024.
Read more: Does Banking’s Digital Focus Endanger Deposits?
A Comparison of the Community Banks Reporting Marketing Expenses
In the next table, the reporting banks are analyzed by their level of spending for 2022.
The banks with the highest marketing expenses — high enough to put them in the top quartile when ranked by the ratio of marketing spend to noninterest expenses — are compared to their counterparts.
With all of the banks being those that reported marketing expenses, there is less differentiation in the results. The fact that the banks have under $2 billion of assets and, on average, only a handful of branches also likely diminishes the opportunity to register much differentiation in this case.
Even so, the top-spending group outpaced the others on loan growth, posting a median growth rate of 14.10%.
The top quartile of spenders ended the year with a median loan-to-deposit ratio of 79.47%, which is a full percentage point higher than the ratio for the bottom quartile.
Looking at the performance of banks with under $2 billion of assets that reported marketing spending
What Did Community Banks with the Highest Revenue Growth Do Differently?
In yet another data slice, CPG took all of the reporting banks and ranked them by revenue growth between 2021 and 2022. These were divided into three categories, the 25% that had the highest revenue growth and the 25% that had the lowest revenue growth, with the remaining 50% in the middle.
So what did those with the highest revenue growth do differently?
This top-performing group grew marketing spending faster than the overall group of reporting banks — significantly faster. The median year-over-year growth in marketing spend for 2022 was 21.17%, compared with 12.25% for all reporting banks.
“They also spent slightly more of their noninterest expense budget on marketing and performed better across virtually all performance metrics in 2022,” says Akins.
Their annual loan growth was a median of 19.52% versus 13.36% for the whole group. Likewise, their demand deposit growth was a median of 5.46%, versus 3.67% for the whole group.
A closer look at the top-performing banks with under $2 billion of assets
Footnotes to the tables
1. Top consolidated bank holding companies, banks, and thrifts with total assets under $2 billion as of Dec. 31, 2022. Excludes industrial banks, non-depository trusts, foreign-owned banks, and bankers’ banks. Institutions with credit cards to total loans of more than 25%, loans to total assets of less than 20%, loans to total deposits of less than 50% at Dec. 31, 2022, were excluded. Institutions that reported negative noninterest income in 2021 were excluded, as were institutions that did not report data in 2022. Institutions that received a tax benefit of greater than 10% of net income for any year between 2020 and 2022 were excluded. Institutions that participated in an M&A between 2020-2022 were also excluded.2. Revenue: Total of interest and fee income on loans; income from lease financing receivables; interest income on balances due from depository institutions; interest and dividend income on securities; interest income from assets held in trading accounts; and interest income on federal funds sold and securities purchased under agreements to resell in U.S. offices of the bank and of its edge and agreement subsidiaries, and in IBFs. This also includes income from fiduciary activities, service charges on deposit accounts in U.S. offices, trading gains from foreign exchange transactions, other foreign transaction gains, gains and fees from assets held in trading accounts, and other noninterest income.
3. Banks with Marketing Spend Reported: Banks that had more than 7% of their other noninterest expense dedicated to marketing spend and had a marketing spend that was more than $100,000. Other noninterest expense includes: data processing expenses, advertising and marketing expenses, directors’ fees, printing, stationery, and supplies, postage, legal fees and expenses, FDIC deposit insurance assessments, accounting and auditing expenses, consulting and advisory expenses, automated teller machine and interchange expenses, telecommunications expenses, other real estate owned expenses, insurance expenses (not included in employee expenses, premises and fixed asset expenses, and other real estate owned expenses).