A perennial question for marketers is, how much should we be spending?
Community banks have never had the budgetary freedom to spend with reckless abandon, as many fintechs and neobanks did before the capital spigot stopped flowing so freely.
So bank marketers tend to look for benchmarks for their budgets — to see if they are investing less in growth than their peers and to figure out how much they should request at budget-setting time.
This analysis of bank marketing spending — which focuses on banks with assets of $2 billion to $10 billion as of yearend 2022 — aims to help.
It draws on data from the Federal Deposit Insurance Corp., with one of the key data points being the “advertising and marketing expenses” item required in call reports. A bank is required to submit this information when its advertising and marketing expenses total $100,000 or more and when these expenses exceed 7% of its total “other noninterest expenses.”
That line item doesn’t include every expense incurred by a bank’s marketing function. Salaries, for example, appear elsewhere. Other departments also might end up covering expenses for marketing technology, consulting and more, as the approach varies from one bank to the next.
Nonetheless, this data offers insight into marketing spending across all institutions and provides a basis for assessing trends.
The Financial Brand partnered with Capital Performance Group on this project. Claude Hanley, a partner at the consulting firm, and Ally Akins, a consultant there, provided the data analysis.
The second installment in our series covers banks with under $2 billion of assets.
About the study:
CPG analyzed data for 286 banks nationwide that had assets of $2 billion to $10 billion as of yearend 2022. The group excludes those that acquired another bank in the three-year period covered by the study (2020, 2021 and 2022).Of the 286 banks, 149 — or 52% — reported their advertising and marketing expenses to regulators. These “reporting banks” are, by definition, spending more on marketing than those that don’t report marketing expenses.

The Financial Brand Forum Kicks Off May 20th
Explore the big ideas, new innovations and latest trends reshaping banking at The Financial Brand Forum. Will you be there? Don't get left behind.
Read More about The Financial Brand Forum Kicks Off May 20th

Navigating the Role of AI in Financial Institutions
83% of FI leaders agree investing in AI is essential for 2024 but how you leverage AI is instrumental in success and meeting customer expectations.
Read More about Navigating the Role of AI in Financial Institutions
Do Banks Reporting Marketing Expenses Grow More Than Peers?
The analysts quickly determined that a direct correlation between marketing spending and profitability is not possible. That’s because many factors beyond marketing impact how profitable a bank is.
Provisioning for loan losses and, conversely, the release of loan-loss allowances, as well as securities gains or losses are completely out of the marketing function’s control and influence. Another example is the cost of compliance, especially in a year when a major new regulatory regimen begins. The effect on profitability for each of these things can be dramatic, and none of them have any link to the marketing budget.
Revenue proved to be a better gauge. Marketing spending can be tied to growth in loans, deposits and new accounts, all of which can influence revenue.
Indeed, the study found that the banks reporting marketing expenses did outperform their peers on several key measures. They grew total loans, demand deposits, and revenue to a greater degree than the banks that did not report marketing expenses, the analysis shows.
Read more: How CMOs Can Maximize Their Marketing Budgets & Prevent Cuts
Three-Year Trend in Bank Marketing Spending
In 2020, when the Covid lockdowns were in effect, marketing underwent a dramatic downshift. Many financial institutions went “gray,” if not “dark.”
For example, the cost of presenting events and promoting them was temporarily off the table — and off the ledger — with the exception of events that could be done virtually via Zoom or another platform.
Marketing goals shrunk to a few essentials, such as encouraging people who had resisted digital banking to learn how to use it in a hurry and helping them do so. Later came the push to publicize government pandemic help, especially the opportunity to apply for small business loans under the Paycheck Protection Program.
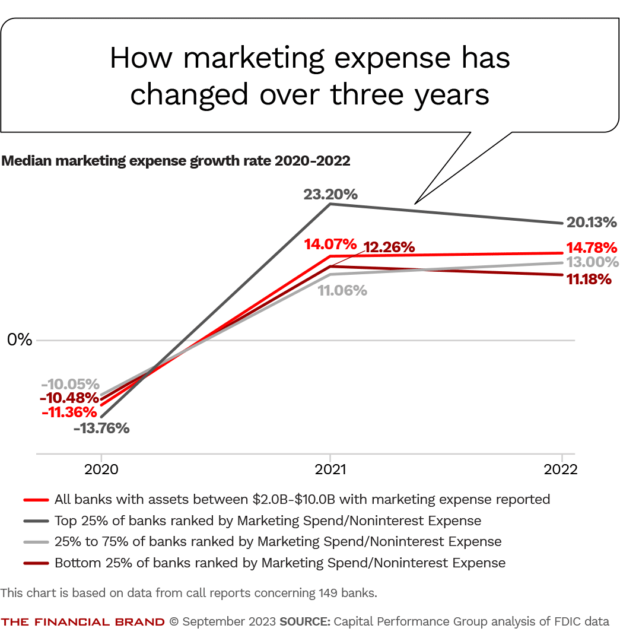
This pandemic plunge can be seen in the chart below, with the median growth rate for 2020 marketing expenses among the reporting banks being negative.
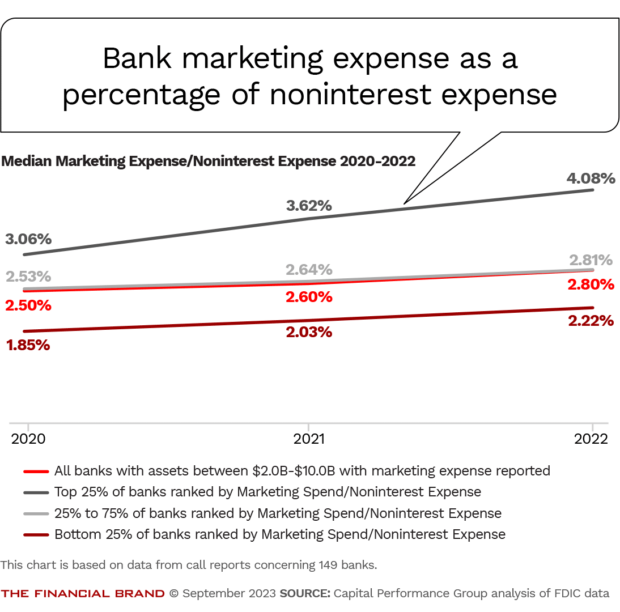
The chart reflects the change in marketing spend as a percentage of noninterest expenses across the three-year period. It compares the median for all 149 reporting banks with three subsets: those that are the highest spenders (top 25%), those that are the lowest spenders (bottom 25%), and those in the middle.
The “comeback” in 2021 indicates some faith in the power of marketing to move performance, especially among the top spenders. The median increase in spending among those institutions hit 23.2%, which means some were even higher. That rate of increase is over twice the median rate for the bottom quartile (11.06%).
The spending increases in 2022 stayed roughly level with the 2021 increases for each group. The median increase in the marketing budget for the top spenders was once again more than 20%.
But it’s important to keep the spending trend over the last few years in perspective. Post-pandemic inflation has raised the cost of many things, including the components of marketing.
Looking at marketing spend as a percentage of noninterest expense shows that the increases are not nearly as dramatic as the raw growth rate might suggest.
Read more: The Right and Wrong Way to Cut a Bank Marketing Budget

Analysis of the Banks Reporting Marketing Expenses
The analysis here compares the banks with $2 billion to $10 billion of assets in a variety of ways.
In the table below, all banks in this size group are measured against the subgroup of banks that reported marketing expenses and the subgroup of banks that did not report marketing expenses.
Looking at the performance of banks with $2-$10B of assets — those reported marketing spending vs. those that didn’t
The 149 banks reporting marketing expenses, as a group, outperformed their peers on several key measures for 2022. The reporting banks posted higher median growth in loans (16.11%), demand deposits (2.19%), and revenue (9.95%). They also had a higher median loan-to-deposit ratio (88.02%).
For the next table, the reporting banks are parsed based on their level of spending for 2022. The banks with highest marketing expenses — high enough to put them in the top quartile when ranked by the ratio of marketing spend to noninterest expenses — are compared to their counterparts.
The top spenders were significantly smaller in terms of asset size and number of branches than both the “middle spend” (the two middle quartiles) and “bottom spend” (bottom quartile) groups. CPG suggests that these are among the factors prompting the higher spending on marketing, due to the perceived need to boost brand recognition and awareness in order to grow.
Looking at the performance of banks with $2-$10B of assets that reported marketing spending
The top spenders grew loans (18.70%) and deposits (4.82%) to a greater degree than either the middle or bottom groups.
However, the most frugal group of reporting banks (the bottom quartile) did end up with the highest ratio of revenue per dollar spent on marketing.
In yet another data slice, CPG took all of the reporting banks and ranked them by revenue growth between 2021 and 2022.
This yielded a group of 37 banks representing the top quartile in terms of revenue growth. Every one of them posted revenue growth exceeding 15.3%.
A closer look at the top-performing banks with $2-10B of assets
The median asset size of this group of top performers was 6.6% smaller than that of the overall peer group.
Their marketing spending also grew slightly faster. The data suggests their efforts focused more on loan growth than on deposit growth, though their median ratio of loans to deposits (85.26%) remains lower than the peer group (88.02%).
They posted median loan growth of 20.31%, compared with 16.11% for peers, and median demand deposit growth of 1.47%, compared with 2.19% for peers.
The top performers had a median cost of funds eight basis points lower than the peer group, and their net interest margins were four basis points higher.
Read more: First Horizon’s CMO Powers Through Merger Misfire with Growth Strategy
Footnotes to the tables
1. Top consolidated bank holding companies, banks, and thrifts with total assets between $2 billion and $10 billion as of Dec. 31, 2022. Excludes industrial banks, non-depository trusts, foreign-owned banks, and bankers’ banks. Institutions with credit cards to total loans of more than 25%, loans to total assets of less than 20%, loans to total deposits of less than 50% at Dec. 31, 2022, were excluded. Institutions that reported negative noninterest income in 2021 were excluded, as were institutions that did not report data in 2022. Institutions that received a tax benefit of greater than 10% of net income for any year between 2020 and 2022 were excluded. Institutions that participated in an M&A between 2020-2022 were also excluded.2. Revenue: Total of interest and fee income on loans; income from lease financing receivables; interest income on balances due from depository institutions; interest and dividend income on securities; interest income from assets held in trading accounts; and interest income on federal funds sold and securities purchased under agreements to resell in U.S. offices of the bank and of its edge and agreement subsidiaries, and in IBFs. This also includes income from fiduciary activities, service charges on deposit accounts in U.S. offices, trading gains from foreign exchange transactions, other foreign transaction gains, gains and fees from assets held in trading accounts, and other noninterest income.
3. Banks with Marketing Spend Reported: Banks that had more than 7% of their other noninterest expense dedicated to marketing spend and had a marketing spend that was more than $100,000. Other noninterest expense includes: data processing expenses, advertising and marketing expenses, directors’ fees, printing, stationery, and supplies, postage, legal fees and expenses, FDIC deposit insurance assessments, accounting and auditing expenses, consulting and advisory expenses, automated teller machine and interchange expenses, telecommunications expenses, other real estate owned expenses, insurance expenses (not included in employee expenses, premises and fixed asset expenses, and other real estate owned expenses).


