Recently, many of our clients in Wealth Management & Advisory Services have been understandably curious about how this year’s elections might affect market returns. With the political landscape heating up, it is no surprise that investors are feeling a bit uneasy about what might lie ahead.
Putting aside the partisan noise, I decided to take a closer look at US market performance during presidential election years since 1980. I reviewed total return data for large cap equities, small cap equities, and core fixed income to gain insights into how markets have typically fared during the election cycle. The data revealed some interesting patterns.
The table below details total returns from 1979 to 2023, comparing the year of the US presidential election to the first, second, and third years of a presidential administration. Data was obtained from Morningstar.
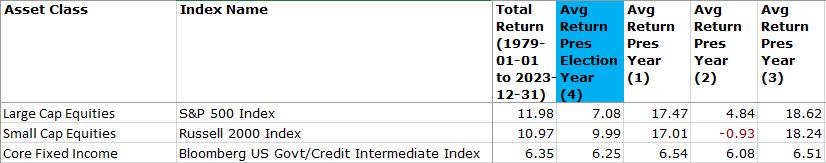
Historical market performance shows that returns have been positive on average during US presidential election years, averaging 7.08% for large cap equities, 9.99% for small cap equities, and 6.25% for core fixed income. It is noteworthy that these returns are slightly lower when compared to the average annualized total return over the entire period of 11.98% for large cap equities, 10.97% for small cap equities, and 6.35% for core fixed income. While these returns are slightly lower when compared to the long-term averages, it is also important to note that they are still positive. The slight dip in performance likely reflects investor uncertainty surrounding the election outcome. Nevertheless, it is essential to recognize that positive returns have still been the norm.
Interestingly, market performance has been strongest in the third year of a presidential administration, and weakest in the second year. This observation underscores the importance of maintaining a long-term perspective and not being swayed by short-term fluctuations (i.e. political events). The graph below illustrates annual market performance during the actual presidential election years since 1980 for large cap equities, small cap equities, and core fixed income. There have been eleven elections cycles.
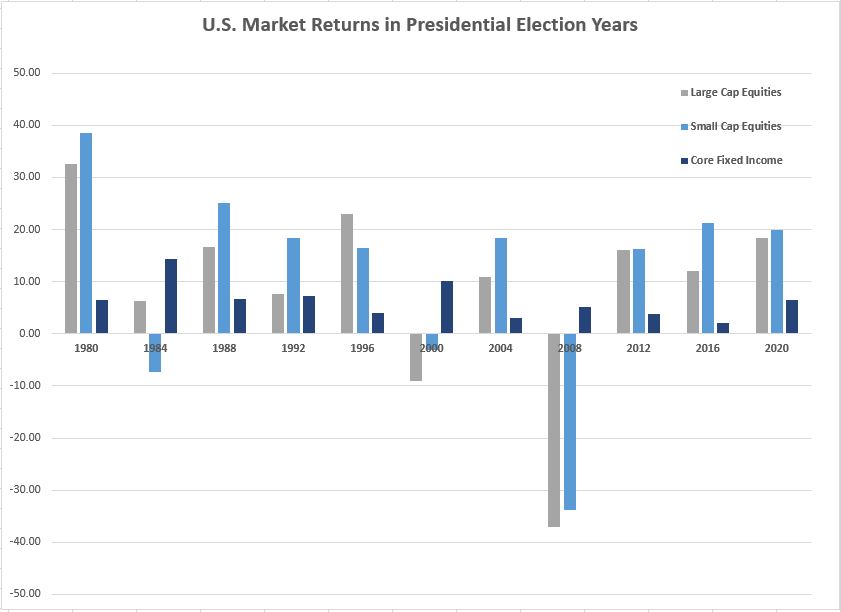
The graph shows that large cap equities returns were positive nine of the eleven elections (or 81.8%). Small cap equities returns were positive eight of the eleven periods (72.7%). Core fixed income returns were positive in all the presidential election years reviewed.
The uncertainty surrounding policy changes and potential shifts in US Presidential leadership can lead to short term changes in stock prices and investor sentiment. While it is essential to acknowledge the uncertainty and potential volatility surrounding presidential elections, it is equally important to recognize that it doesn’t usually have a long-term negative impact. In fact, history has shown that market returns have more often than not been positive over the long term.
Washington Trust Bank believes that the information used in this study was obtained from reliable sources, but we do not guarantee its accuracy. Neither the information nor any opinion expressed constitutes a solicitation for business or a recommendation of the purchase or sale of securities or commodities.
Nick is a Vice President and Portfolio Manager for Washington Trust Bank’s Wealth Management & Advisory Services. He offers our clients the expertise to analyze portfolios and unique assets to ensure that they are suitable for meeting our clients’ goals and needs. Nick partners with our Relationship Managers to provide continual analysis to ensure that these customized portfolio solutions maintain the balance between risk and growth in order to ensure continued success in meeting the clients’ goals.
![]() Links with this icon are leaving Washington Trust Bank's website. This link is provided as a courtesy. Washington Trust Bank does not endorse or control the content of third party websites.
Links with this icon are leaving Washington Trust Bank's website. This link is provided as a courtesy. Washington Trust Bank does not endorse or control the content of third party websites.
Home | Contact | Locations | Privacy Policy | Terms & Conditions | Safe Act Numbers | Posting Rules
Rates and fees subject to change. Entire contents: Copyright 2014 Washington Trust Bank. An Equal Opportunity Employer.


