Consumers have been banking online for 28 years. And from the very beginning, there have been pure-play digital banking startups. The first, online bank Security First Network Bank (SFNB) launched in 1995, just a year after Amazon.com. Elon Musk’s second startup, X.com (now PayPal), launched in 1999. But unlike ecommerce, digital-only banking was slow to catch on. The legacy players held their market share by providing digital services deemed “good enough” to retain customers loath to switch banks.
But that began changing about a dozen years ago as money as a flood of so-called neobank startups cropped up all over the world. Venture investors saw consumer banking as ripe for disruption in the aftermath of the 2007-2009 financial crisis. In the 15 years after the financial crisis, $27 billion (a mix of equity & debt) was invested in the leading United States consumer challenger banks. Here are the numbers:
- 32 banks were launched in the 2008 to 2016 period including 17 of the 18 largest today
- Zero (remaining banks) were launched before 2008
- Only 8 have been launched in past 4 years (2020 to 2023), and none have made the top 25 (highest rank is 28)
- 23 were launched in 2016 to 2019, but only 3 of those have cracked the top 25
So who are the best digital challenger banks? Let’s start with our definition.
- Centered around deposit and debit/credit card services
- Predominantly focused on consumers
- Primarily digitally delivered (rules out Wells Fargo, BofA, and the majority of traditional banks*)
- Founded since 1999
Do you run a small business:?Looking for small business resources? Check out our latest lists: Small Business (SMB) savings/treasury accounts (7) | SMB online lenders (33) | SMB challenger banks (15) | SMB insurers (15) | SMB charge cards/expense management (16) | Billpay & invoicing (16)| Payment processors (7) | Subscription processors (7) | SMB digital accounting/bookkeeping (21)
The FAB Score (Fintech Attention Barometer) is a proxy for the size of a private fintech company.
Leading Digital Consumer Banks (United States)*
ranked by our FAB score (Fintech Attention Barometer**)
| Company | FAB Score** | Founded | HQ | Visits (Oct ’23) | TrustPilot Score | Trustpilot Reviews | Funding ($M***) | |
| 1 | Wise (Transferwise) | 10,580 | 2011 | London | 38,100,000 | 4.2 | 197,000 | $1,700 |
| 2 | Robinhood | 6,080 | 2013 | SF | 17,190,000 | $6,200 | ||
| 3 | SoFi | 4,020 | 2011 | SF | 13,080,000 | 4.6 | 7,270 | $4,100 |
| 4 | Revolut | 3,000 | 2015 | London | 11,460,000 | $1,700 | ||
| 5 | Chime | 2,730 | 2012 | SF | 10,710,000 | 2.6 | 8,860 | $2,300 |
| 6 | Upgrade | 1,430 | 2016 | SF | 3,013,000 | 4.5 | 39,600 | $587 |
| 7 | Credit Sesame | 1,200 | 2010 | SF | 5,730,000 | $172 | ||
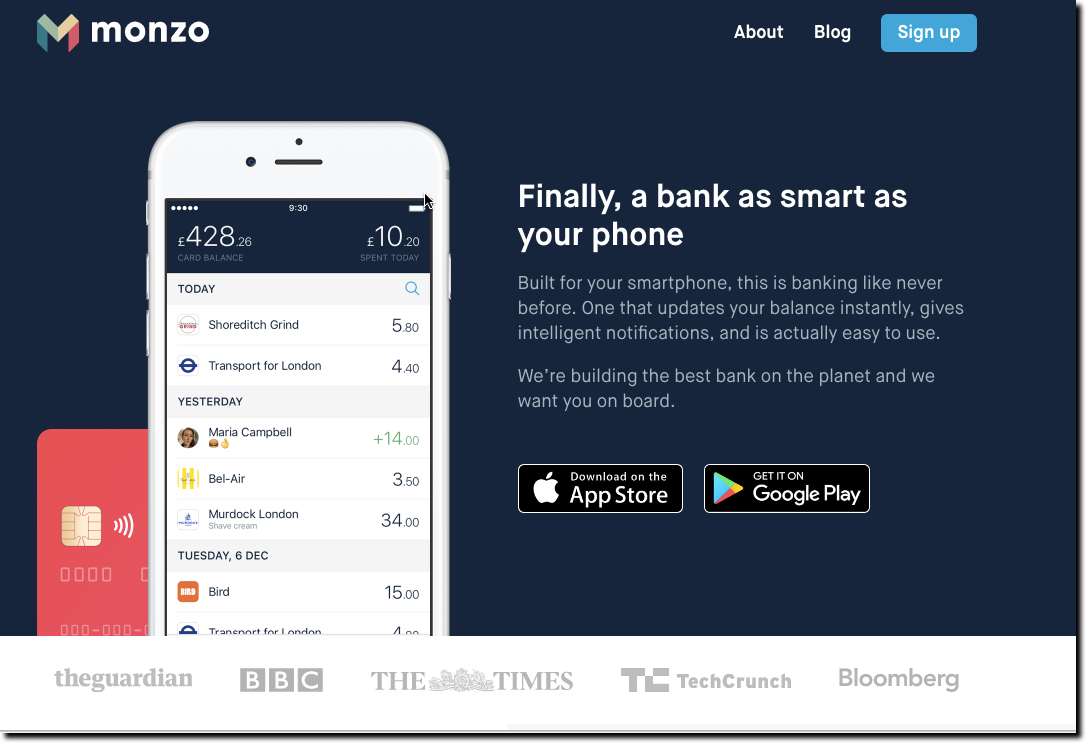
| 8 | Monzo | 1,090 | 2015 | London | 3,390,000 | $1,100 | ||
| 9 | MoneyLion | 873 | 2013 | NYC | 1,260,000 | 4.6 | 28,100 | $473 |
| 10 | Stash | 770 | 2015 | NYC | 3,050,000 | 2.9 | 2 | $520 |
| 11 | Acorns | 613 | 2012 | LA | 2,170,000 | 2.3 | 350 | $540 |
| 12 | Dave | 554 | 2016 | LA | 1,560,000 | 2.8 | 3 | $536 |
| 13 | Empower | 550 | 2016 | SF | 2,350,000 | $175 | ||
| 14 | Varo | 506 | 2015 | SF | 838,000 | 2.7 | 2,500 | $992 |
| 15 | Betterment | 498 | 2008 | NYC | 1,930,000 | $435 | ||
| 16 | Wealthfront | 453 | 2011 | SF | 1,964,000 | $274 | ||
| 17 | Petal | 404 | 2016 | NYC | 340,000 | $992 | ||
| 18 | Braid | 390 | 2019 | SF | 12,000 | $0 | ||
| 19 | M1 Finance | 371 | 2015 | Chicago | 1,230,000 | 2.2 | 161 | $323 |
| 20 | Branch | 357 | 2015 | Minneapolis | 222,000 | $633 | ||
| 21 | Albert | 315 | 2015 | LA | 1,270,000 | $176 | ||
| 22 | Current | 307 | 2015 | NYC | 856,000 | $402 | ||
| 23 | Greenlight | 302 | 2014 | Atlanta | 458,000 | 3.8 | 4,870 | $557 |
| 24 | Step | 264 | 2018 | SF | 128,000 | 4.6 | 1,080 | $491 |
| 25 | One Finance | 248 | 2019 | SF | 1,110,000 | 1.7 | 124 | $66 |
| 26 | Axos | 220 | 2013 | 1,110,000 | $0 | |||
| 27 | Green Dot | 192 | 1999 | LA | 1,018,000 | $33 | ||
| 28 | Majority | 126 | 2019 | Stockholm | 168,000 | 4.6 | 2,600 | $93 |
| 29 | Extra | 104 | 2018 | NYC | 504,000 | $0 | ||
| 30 | Juno | 102 | 2019 | Singapore | 421,000 | 3.9 | 532 | $21 |
| 31 | Greenwood | 83 | 2020 | Atlanta | 176,000 | $88 | ||
| 32 | Happy Money | 78 | 2009 | LA | 192,000 | $192 | ||
| 33 | Yotta | 71 | 2019 | NYC | 152,000 | 4.7 | 1,720 | $17 |
| 34 | Karat | 69 | 2019 | LA | 45,000 | $116 | ||
| 35 | Oxygen | 58 | 2018 | SF | 205,000 | 2.9 | 257 | $45 |
| 36 | Bambu | 39 | 2016 | Memphis | 166,000 | 2.3 | 10 | $15 |
| 37 | GoBank | 35 | 2013 | LA | 189,000 | 1.4 | 44 | $0 |
| 38 | Copper | 33 | 2019 | Seattle | 47,000 | $42 | ||
| 39 | Bridge Money | 32 | 2019 | Chicago | 123,000 | $8 | ||
| 39 | HMBradley | 32 | 2019 | LA | 73,000 | 3.7 | 3 | $64 |
| 39 | Jiko | 32 | 2016 | SF | 22,000 | $89 | ||
| 42 | Quontic | 29 | 2019 | NYC | 87,000 | 4 | 522 | $13 |
| 43 | Comun | 25 | 2021 | NYC | 84,000 | $5 | ||
| 44 | MoCaFi | 23 | 2015 | NYC | 14,000 | $43 | ||
| 45 | Level | 22 | 2016 | SF | 1,000 | $147 | ||
| 46 | Cheese | 20 | 2019 | LA | 79,000 | $4 | ||
| 46 | Kinly (Greenwood) | 20 | 2020 | Atlanta | 23,000 | $20 | ||
| 48 | Qube Money | 19 | 2019 | Salt Lake City | 65,000 | $8 | ||
| 48 | Cogni | 19 | 2018 | NYC | 17,000 | $31 | ||
| 50 | Fair | 16 | 2021 | Houston | 0 | $20 | ||
| 51 | Qapital | 15 | 2013 | NYC | 49,000 | $47 | ||
| 52 | Atmos | 13 | 2020 | SF | 40,000 | 3.5 | 17 | $0 |
| 53 | Unifimoney | 10 | 2019 | SF | 1,500 | $13 | ||
| 54 | Ivella | 9 | 2021 | LA | 3,000 | $4 | ||
| 54 | Save | 9 | 2018 | Houston | 31,000 | 2.6 | 6 | $0 |
| 54 | Zeta | 9 | 2017 | SF | 29,000 | $2 | ||
| 54 | Totem | 9 | 2022 | Tulsa, OK | 2,000 | $2 | ||
| 58 | Sable | 8 | 2019 | NYC | 27,000 | 1.6 | 130 | $5 |
| 59 | Bella | 7 | 2020 | Las Vegas | 9,000 | $0 | ||
| 59 | Marygold & Co | 7 | 2021 | Denver | 5,900 | $0 | ||
| 61 | Capway | 5 | 2017 | Atanta | 16,000 | $0 | ||
| 61 | Purple | 5 | 2020 | Ft Myers, FL | 0 | $0 | ||
| 63 | Letter | 4 | 2019 | SF | 2,000 | $0 | ||
| 64 | North Loop | 4 | 2019 | SF | 0 | $0 | ||
| 64 | Pinch | 4 | 2019 | LA | 0 | $0 | ||
| 66 | Brightwell | 0 | 2009 | Atlanta | 31,000 | $0 | ||
| Total | $26,600 |
Sources: FintechLabs, Pitchbook, Crunchbase, SimilarWeb; 10 Nov 2023
*Our business model depends on revenue from referrals and sponsors. When you see a referral link in the URL, we may earn a fee when a new account is started (thanks!). This can improve visibility on our website, but does not impact the company’s FAB score.
** The FAB score, Fintech Attention Barometer, is a proxy for the overall size of a private company since they typically do not release traditional metrics (# customers, deposits, AUM, etc). The score is based on VC funding, website traffic, mobile downloads, and the number of employees. It’s a work in progress, so expect changes in the formula.
***Funding is the amount invested into the company as either equity or debt.


