Bank IT Spending – Use These Metrics to Improve Performance

Times are tough. Banks are under pressure to find ways to increase earnings against a backdrop of slower increases in earning assets and quickly rising deposit and credit costs. As such, bank budgets have come under scrutiny. We recently conducted a small sample poll, and out of 21 banks, budgets were down an average of 14% for this year. Marketing and technology (IT) are two budgets that have taken the most significant hit. In this article, we partner with Gartner to look at 2024 key IT metrics and provide strategic insight into how much your bank should be spending on IT.
The State of Bank IT Spending
While Bank IT Spending grew at about 6% last year, this year, budgets were only increased by 4% due to margin pressure. The good news is that for many other areas, budgets are lower at banks compared to last year, and the fact that IT is still positive underscores the strategic imperative that banks face to digitize traditional operations, reduce costs, gain scale, and improve the customer experience.
For perspective, 2023 and what we expect for 2024 can be characterized as keeping up with revenue. Usually, a bank spends about 8% of its revenue on IT. Last year and this year, most of the net change resulted from revenue changes, and the percentage spent has been consistent. IT is spending as a percentage of revenue compared to years past, like 2019, when banks did not invest enough in IT, and 2020, when banks had to spend more than revenue growth allowed because of the pandemic.
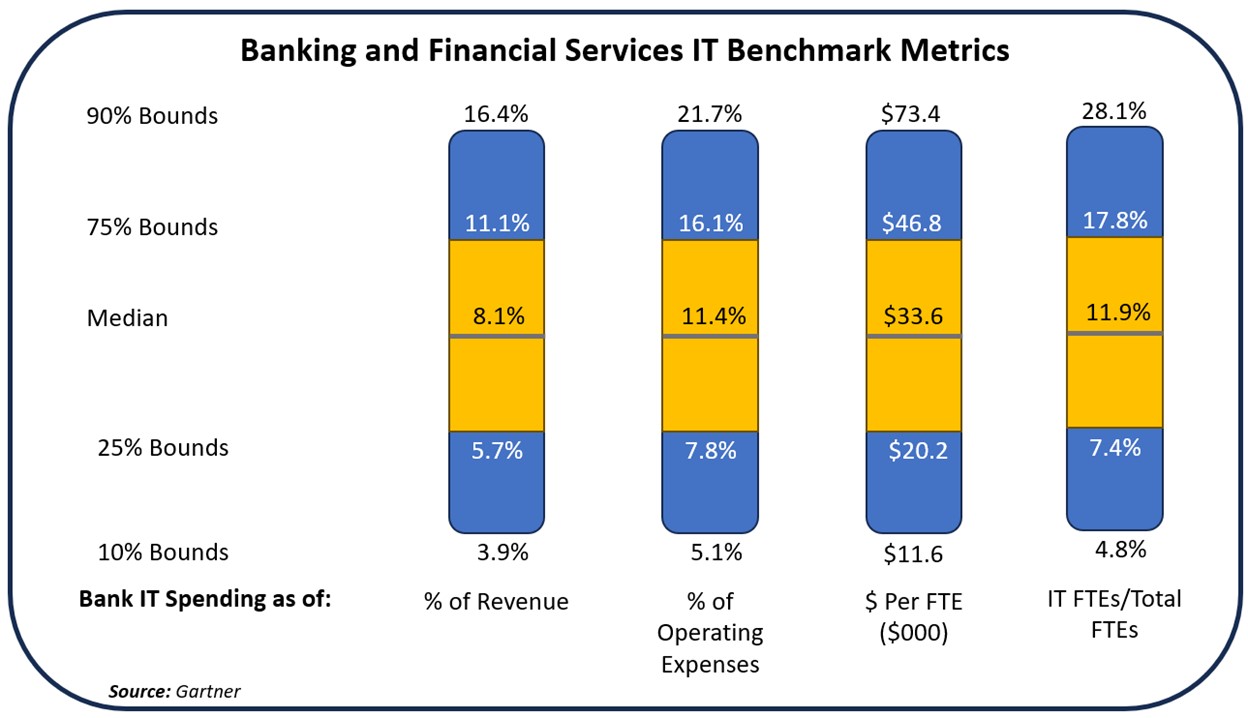
Benchmarking can help banks better optimize capital as it gives bank management a sense of what the average is for the industry. Banks that want to be more aggressive with innovation and technology can show they are investing more in technology infrastructure, while banks with a strategy to be less tech-focused can be under. Regarding benchmarking, it is essential to triangulate metrics across several dimensions. To that end, we utilize Gartner’s data and put together the below graphic utilizing the four main ways banks benchmark IT spending – against revenue, expenses, full-time employees (FTEs), and on an FTE headcount basis.
Bank IT Spending as a Percent of Revenue
Our favorite go-to metric is to benchmark IT spending against total revenue. It can be a major driver of value, and banks must look at IT spending from a defensive view to include basic infrastructure building, cybersecurity, and risk management AND a revenue-building exercise driving new product development, the customer experience, and operational leverage.
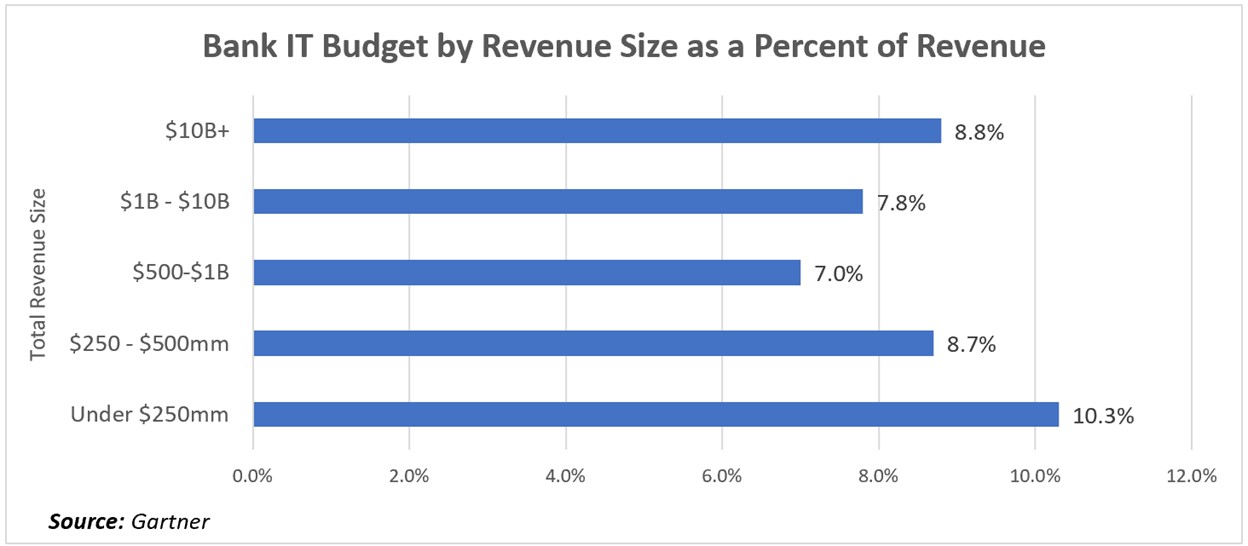
Technology-forward banks spend as much as 16.4% of revenue on technology, while non-tech banks spend as little as 3.9%. The approximate two standard deviation ranges are between 5.7% and 11.1%, with a median of 8.1% for 2023. Due to tighter budgets, this median is expected to be down to 7.9% for 2024. Broken down by revenue size, bank IT budgets look something like the below.
Bank IT Spending as a Percent of Operating Expenses
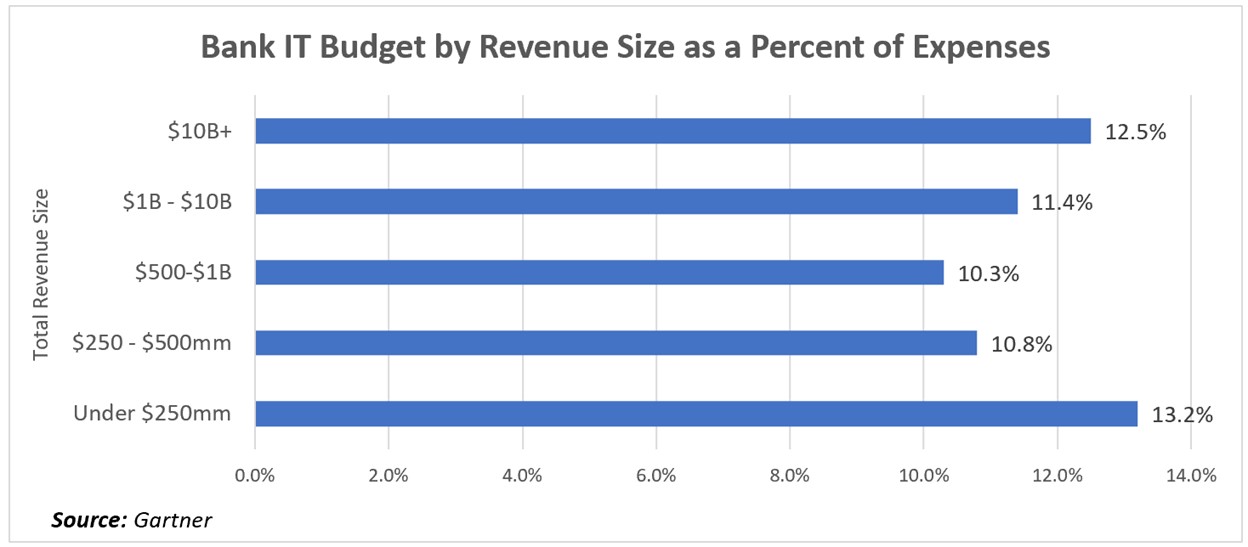
Looking at IT bank spending against operating expenses provides bank executives with another benchmark view. This view helps banks get more granular within their expense base to ensure they align with their peers and business strategy. The 2023 median fell so that bank IT spending made up 11.4% of total expenses; in 2024, this number is expected to be 11.2%. By revenue size, the data looks like the chart below.
Other Bank IT Spending Metrics
Since labor is the single largest input into manufacturing bank profits, it is essential to understand your bank’s labor efficiency related to IT investment. Banks spend between $11,600 and $73,400 per employee on technology, with a median of $33,600 per employee. Due to expected staff cuts, IT spending is likely to grow in 2024 to $35,000 per employee.
As such, IT employees are expected to make up a larger percentage of total employees this year because of staff cuts and the increase of more information security, AI, and data management personnel. Last year, IT staff composed 11.9% of total employees, whereas in 2024, we expect IT staff to comprise over 12.3% of staff for the first time in banking history.
Where the Banks Are Spending Their IT Budget
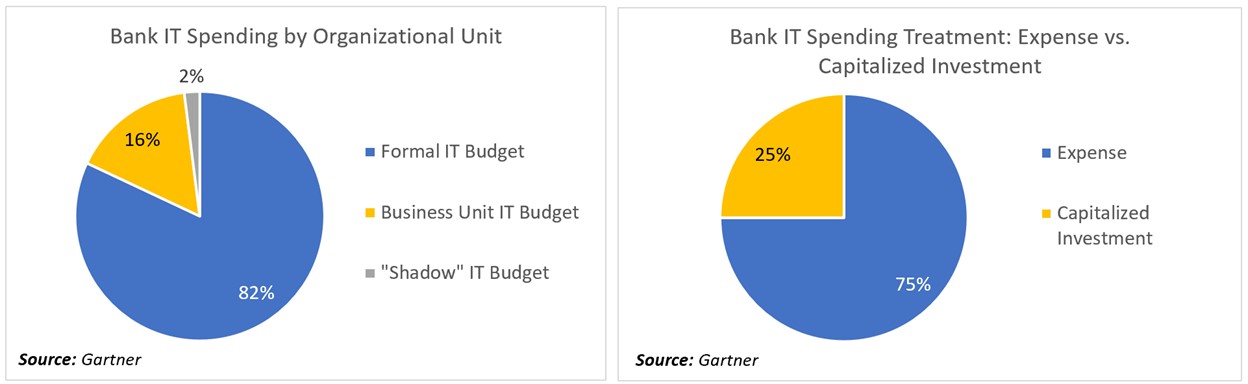
IT spending within a bank can be allocated from a variety of areas. Here, banks are fairly consistent as most centralize the bulk of their spending into a formal IT department. This formal spending is around 82% for a bank. Banks usually spend about 16% outside formal budgets, driven by department budgets such as digital account opening, often within a deposit operational budget. Approximately 2% of bank IT spending arises on a “shadow basis,” which is all the technology spent on someone’s credit card that never gets allocated officially to IT or the business unit. Shadow IT may be in the form of a marketing platform like Canva or Grammarly to assist in writing, two of the more popular shadow expenses.
Regarding the treatment of bank IT expenses, 75% of the budget is structured as an expense and charged within a given year. In comparison, 25% is capitalized and depreciated over three, five, or ten years, depending on the nature of the expense.
The Strategic View of IT Investment
One way that we have found helpful to think about IT investment is along the lines of what is needed to run or to “keep the lights on,” what is needed to grow existing revenue streams, and then what is required in order to innovate to include new products and running experiments plus pilot programs. Based on Gartner data, we also predict that banks will be similar in their strategic allocation for 2024. For 2024, we expect banks to allocate about 67% of the IT budget to maintain the current infrastructure, 22% to grow capabilities, and 11% to innovate.
Of these three categories, we find that community banks usually do not allocate enough of their IT budget towards innovation. Banks looking to stay competitive in areas such as payments, IT agility, customer experience, and product development must explore new ways to engage and be relevant to the target customer.
IT Investment By Category
Perhaps the most helpful benchmarking data is to see where peer banks spend their IT capital.
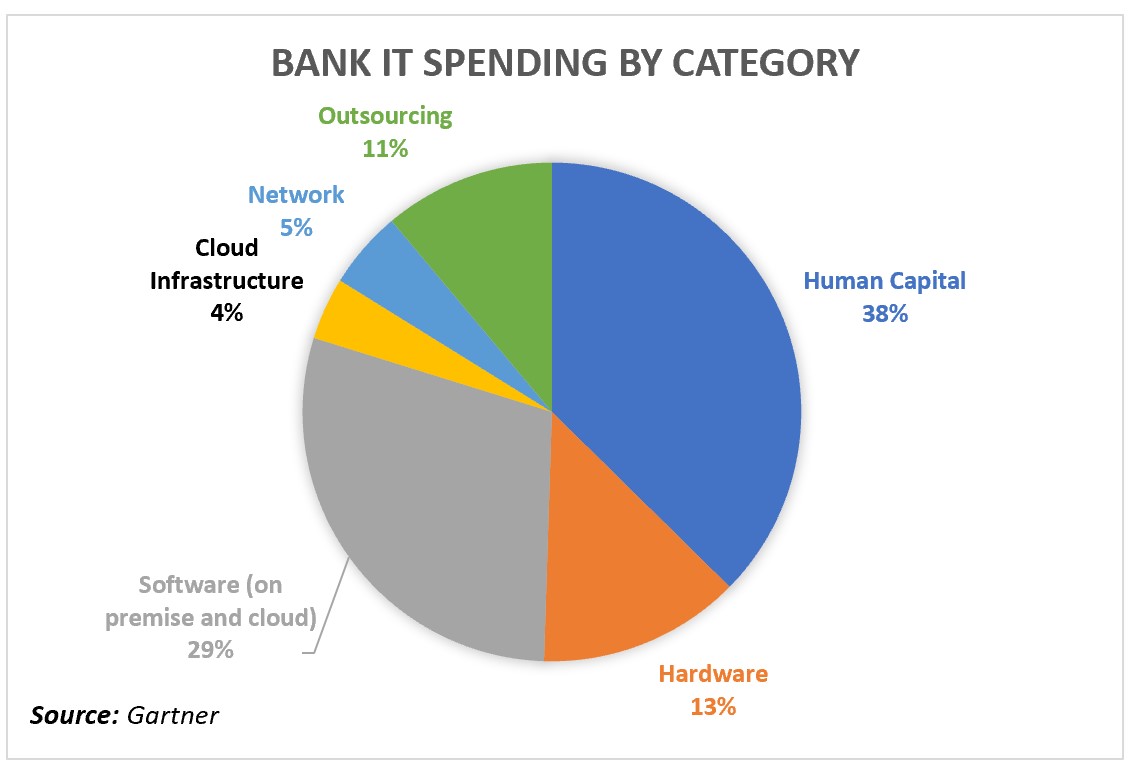
Labor costs should compose a higher percentage of bank IT budgets in 2024 due to the continued fight for talent. In 2022, banks spent about 34% of their budget on human capital; 2024 should see that number get close to 38%. For other line items, expect less investment in on-premise solutions and more cloud-based investment. Another area of reduction, because of tight budgets, is that we are looking for a lower investment in new initiatives and outsourcing.
Putting This Into Action
Benchmarking IT spending helps better allocate capital and provides a framework for discussion within a bank. These discussions should focus on strategic alignment, business focus, and gaining operational leverage (the single best controllable way to create value). Using this data to provide both internal and external perspectives will allow for deeper and more effective communication and decisions.
We do not want to suggest any of this data serve as a target or best practice. Those goals are best left to each management team and will vary based on strategy and tactics. Comparisons to benchmarks can discuss if your investment is at the appropriate level and highlight opportunities to align costs better.
Below are some of our favorite questions to discuss to ensure bank alignment.
- Are you spending enough to support your growth needs?
- What portion of your current budget will assist in transforming the bank, and is that enough? Do you have the appropriate investments in machine learning, artificial intelligence, and data management?
- Are you investing in shortening the time-on-task for the customer, and do you have the right products to stay relevant in the future?
- Is your spending aligned with the institution’s strategic priorities and business initiatives?
- What efficiency or improvement in operating leverage will you see at the end of the year, given the execution of this budget?
- Is your mix of IT assets correct, given your gaps and goals? Where could you spend more? Where could you spend less? How does your IT investment move you within your risk envelope? Will you have increased or decreased residual risk at the end of the year?
- Is all your human capital operating within the 75% to 85% capacity band? Do you have the capacity to give you operational flexibility?
Suppose your IT and executive management team can utilize benchmarks across multiple views like the ones provided and answer the above questions to your satisfaction. In that case, that is a hallmark of a mature and well-run banking organization. Do this, and your bank should see more optimized spending and better business outcomes.