How To Assign FTP Attribution to a Loan

In a previous article (HERE), we discussed the concept of Funds Transfer Pricing (FTP), why systemically important banks and large regional banks incorporate FTP, and why community banks should also consider implementing FTP. We defined an FTP framework, the regulatory recommendation for FTP, and how FTP allows community banks to make better decisions about balance sheet profit contribution (loans versus deposits). In this article, we look at using FTP attribution to better understand lending profitability. We will decompose net interest margin’s (NIM) contribution using a FTP framework for a specific loan and demonstrate how FTP allows community banks to measure the profit contribution of deposits versus loans.
FTP Attribution – A Specific Loan Example
A few months ago, we talked to the CFO and CLO of a $1.4B bank about loan pricing. The CFO and CLO stated that after the last Fed meeting, the lenders were instructed to target a minimum 5.25% coupon on new loan production. Regardless of the term, credit quality, loan size, or deposit relationship, the bank wanted to set a firm line at a 5.25% rate. When pressed about why this was the minimum yield, the CFO responded that, on average, the bank needed a 4.00% net interest margin to earn a 1.00% ROA. The view that this CFO and CLO held was not based on an FTP framework and is reflected by the graph below.
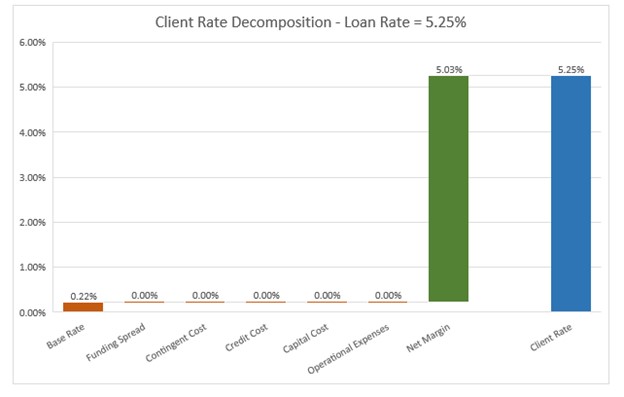
In this graph, the NIM on the loan is the coupon of 5.25% fixed for five years, minus the bank’s current cost of funding equal to 0.22% (base rate). The bank is targeting a 4.00% NIM regardless of an FTP framework.
The problem with the above analysis is that the funding cost of 0.22% is a point in time versus a 5-year fixed rate. There is an interest rate and liquidity component that the bank is not measuring. Using an FTP attribution framework allows banks to measure and allocate the cost of raising funds for loans. FTP requires the bank to convert the current funding cost to a long-term cost for five years (the length of the loan commitment). This cost is currently 3.12% over the bank’s cost of funding (funding spread). Further, there is a cost of holding liquidity in the event deposits are difficult to source in the future. Depending on business lines, products, and funding activities, there is a contingent cost of funding during stressful events such as collateral calls, deposit runoffs, or standby credit draws. This contingent cost is different for different banks but should be considered by each bank. For our bank above, we believe the contingent cost is 0.26%.
The additional shortcoming of the analysis by the CFO and CLO is that not all loans are created equal, and the FTP attribution framework allows us to assess credit cost (or the expected probability of default or ALLL), capital costs (the unexpected defaults that are offset by capital), and operational expenses (direct overhead of the loan activity). Subtracting all of the loan activity FTP costs allows us to calculate the net loan margin, as shown in the graph below.
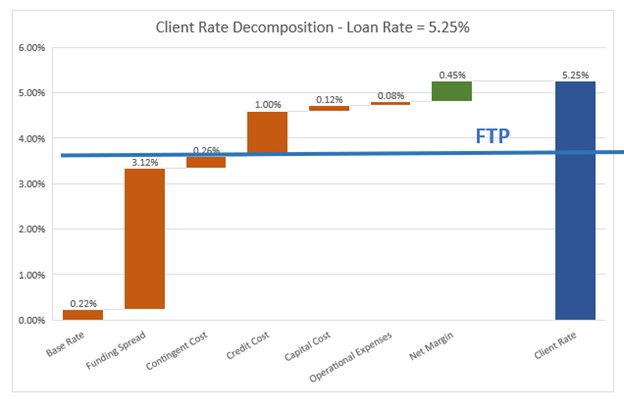
In this graph, the bars below the FTP line are the costs of deposit gathering, and the bars above the FTP line are the costs of loan generation. Here, you can clearly see FTP attribution. This is only one way of building an FTP framework. Nonetheless, using this FTP framework, we see that the bank’s lending function adds only 45bps in net margin. This loan is profitable, but barely so. If any of the assumptions are off by 45bps – if the sum of credit cost, capital cost, or operational expenses are 45bps higher – then the loan becomes a negative economic contribution for the bank.
The FTP framework measures interest rate, credit, and liquidity risk and enables costs to be transferred from central treasury functions to the bank’s products and business lines. Community banks can then better measure the economic value obtained from each action taken separately.
FTP attribution allows community bank managers to understand better the profit contribution of its balance sheet products (loans versus deposits), which channels, officers, and customers are more profitable, and create internal accountabilities and associated targets for funds users (credit risk takers) and funds providers (deposit gatherers).
Conclusion
By incorporating an FTP attribution framework, banks can change the understanding of the makeup of net interest margin and how the bank’s activities have contributed to economic profitability. Too often, commercial lenders’ and management’s focus and incentive plans are not correctly aligned with the institution’s processes for measuring economic contribution. Using an appropriate FTP framework, a community bank can devise target pricing and incentive plans focusing on the incremental margin that loans generate after transfer pricing. Extending this approach to add economic capital to determine a risk-adjusted return on capital (RAROC) takes into consideration not only the volume and spread but also the underlying risk when calculating contribution and the associated incentive compensation plan.