Understanding The Current Yield Curve Shape

After last week’s FOMC rate increase of 25 basis points, the yield curve is more inverted than at any time in the previous 30 years. The current yield curve presents various challenges for community bankers for revenue generation and risk management. In this article, we will outline the significance of the yield curve shape and what it may portend for community banks. In future articles, we will discuss how some top-performing banks are deploying strategies for deposits, loans, and risk management in the current interest rate environment.
The Yield Curve Shape
A yield curve is a relationship between maturities and yields. The yield curve’s slope can provide insight into present and future interest rate changes and economic activity. Most of the market focuses on the relationship between the two and 10-year Treasury yields. However, for bankers, the critical maturities, in our opinion, are short-term rates (Fed Funds or SOFR) and the 10-year Treasury rate. The average bank’s cost of funding is highly correlated to Fed Funds and SOFR (for the industry, the correlation has been 94% with a 6-month lag over the last 20 years), and borrowers continue to demand 10-year financing for commercial debt. Therefore, it is essential for bankers to understand the shape of the yield curve between short-term rates and ten years.
There are three generic shapes of the yield curve: normal, inverted, and flat. These shapes are shown below.
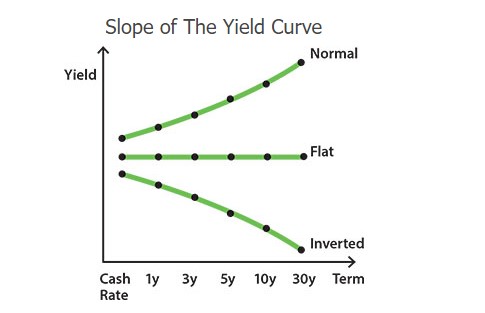
Three main theories explain the shape of the yield curve. First is the expectation theory. Investors expect short-term rates to average the long-term rate over the maturity period. Therefore, an inverted yield curve signals that investors expect short-term rates to be lower in the future, and a normal yield curve signals that investors expect short-term rates to be higher in the future. The second is the term premium theory. Investors typically require a higher return for lending funds for longer periods, and the normal yield curve is a more natural phenomenon. The third is the preferred habitat theory. This theory states that different investors prefer a particular maturity over others and are willing to buy different maturities only with a yield premium. A yield curve inverts if bond investors seek longer-term maturities, as the case may be made for aging populations and investing needs of pension funds, insurance companies, and sovereign investors.
The Current Yield Curve
The graph below shows the yield on Fed Funds and 10-year Treasury for the last 30 years. The 10-year yield is above Fed Funds for the vast majority of the time, and the two lines typically cross during recessions when the 10-year yield falls because of recession fears. Over this 30-year period, the ten-year yield is, on average, 1.57% higher than the Fed Funds rate.
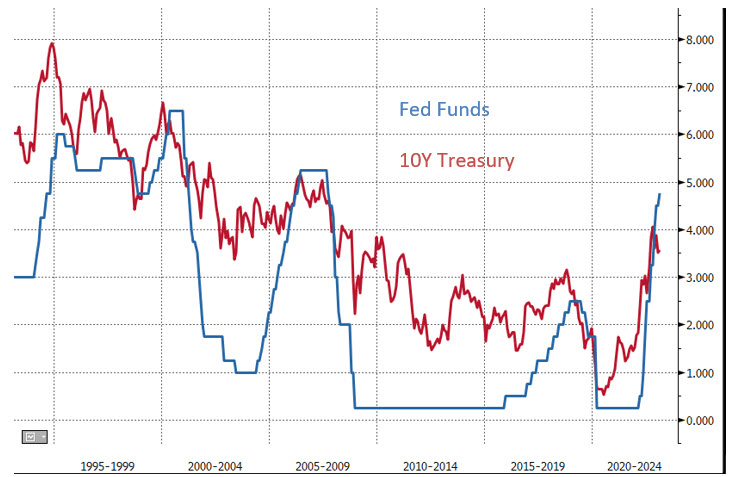
However, the Fed Funds rate is currently 1.01% above the ten-year Treasury rate. This level of inversion has not happened in the last 30 years. Many bankers can benefit from understanding the challenges and opportunities such a yield curve creates for community banks.
Projecting The Yield Curve Shape
We do not believe that economists, analysts, or pundits can forecast future interest rates or the shape of the yield curve. Every person that earns a living making projections has some personal stake in trying to persuade the audience of their view. If that person knew they could accurately forecast rates, you would never hear from them (they would trade on their ability and not share their view). We prefer to look at the market’s projections based on the futures market, where participants risk billions of dollars to take positions.
We also do not believe that bank managers should be positioning their balance sheet based on one forecast. Instead, the analysis must attribute probabilities for various outcomes, and bank managers must optimize their strategy to address all possible outcomes given different probability weightings.
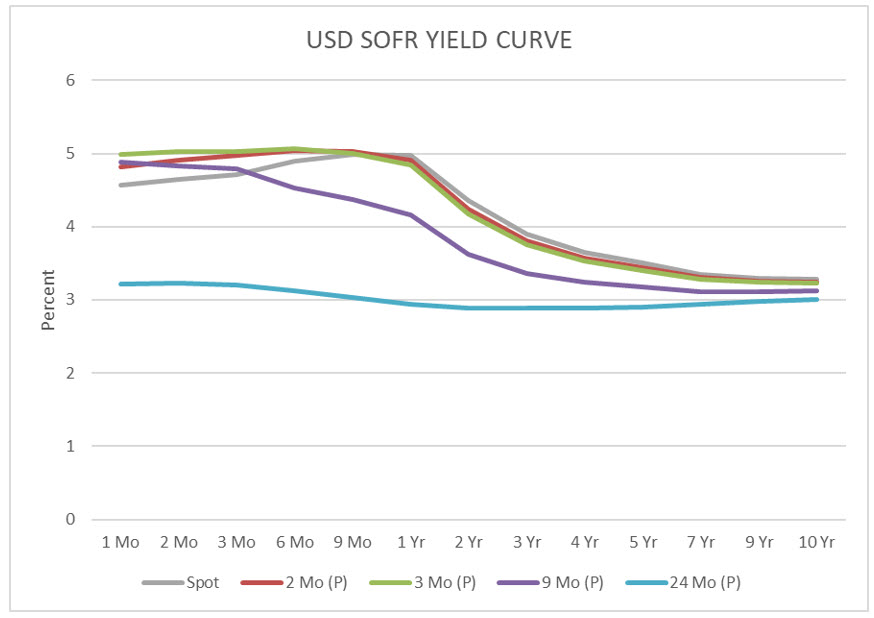
The graph below shows the yield curve (USD SOFR) from 1 month to 10 years today (spot) and is projected for two to 24 months. The yield curve shape is projected to remain inverted for the next two years.
Implications for Community Banks
On deposits, banks must be careful how they raise funds and reprice their current deposit base. In an environment with an inverted flat yield curve and rising cost of funding, banks need to focus on their deposit rate sensitivity. This makes Treasury management, goal-oriented accounts, health savings accounts, and similar longer-duration products more valuable. Community banks should allocate more sales time and marketing expenses to expand balances in these products.
As short-term interest rates rise, bankers must consider which existing floating-rate loans will refinance into fixed-rate structures. Bankers also need to address credit risks from floating rate structures. For those borrowers that do not take the opportunity to fix their loan rates, bankers need to consider the DSC ratios when interest payments increase. Further, as short-term interest rates continue to rise, borrowers on fixed-rate structures may take the opportunity to refinance their loans early to lock in longer terms for their credit facilities. This may put banks under additional pressure to extend the duration of their loan portfolio as the cost of funds (COF) is also increasing.
Most importantly, community banks must create a proactive (not just defensive) 10-year commercial lending product. A product that is both profitable for the bank and appealing to a large segment of the bank’s prospect base. If the rate on a 10-year fixed rate loan is 100 bps lower than a floating rate alternative, a vast majority of borrowers will opt for the certainty of a fixed rate.
Conclusion
The current inverted yield curve shape pressures certain banks’ business models. This inversion is expected to remain for some time, and bankers need to develop strategies to manage risk and return in this unusual interest rate environment. In a future article, we will share some strategies top-performing banks use to increase return and manage risk, specifically taking advantage of the current yield curve inversion.