Should You Be Marking Loans To Market?

Available-for-sale securities are reported at fair value, and any unrealized gains and losses are included in accumulated other comprehensive income (AOCI) in the equity section of the balance sheet. The AOCI is an accounting adjustment meant to reflect the economic value of assets and is the process of “marking loans to market.” That same adjustment can be applied to banks’ fixed-rate loans for economic value analysis to better understand value creation and allocation, prioritize future business activity, and better deploy capital. In this article, we explore what signals marking your loans to market might send.
A Short History of Asset Marks
It was back in August of 2007 when credit spreads started to widen. It started first in housing and then reverberated through each sector in succession – consumer credit, small business credit, corporate receivables, commercial real estate, and then bank loans. By late 2007, liquidity started to dry up and credit spreads were materially wider. Banks had enough liquidity so it didn’t really matter in terms of day-to-day operations. However, the public markets were another story. Without liquidity, finance companies and investment banks had to draw on their lines. Capital got scarce. By 2008, there were a variety of failures as a result of liquidity – Bear Sterns, Lehman Brothers, and more. Spreads gapped out and the economy, including every bank, had an asset liquidity problem and then a credit problem. If only banks would have heeded the warning in 2007.
Today’s Environment
Fast forward to today. S&P Global estimates that in 2022, AOCI has reduced the tangible equity ratio at community banks (below $10B in assets) by an average of 1.99% (from 10.74% to 8.75%). However, community banks hold approximately 23.5% of assets in securities and 63% of assets in loans. Further, of all loans at community banks, approximately 71% are fixed-rate loans. The average contractual term of a community bank’s loan portfolio is around four years. Therefore, community banks are experiencing approximately six to eight times higher negative AOCI from their loan portfolios than their securities portfolio.
If you are a bank investment portfolio manager, you have likely already been adjusting the duration, convexity, and liquidity of your investment portfolio. You see the negative mark-to-market, largely caused by interest rates, and you have been adjusting accordingly. Marking your investments to current value provides a consistent and actionable feedback loop. As rates move up, risks get embodied in the portfolio’s performance and bankers act to mitigate that risk. Unfortunately, loans are not the same.
Economic Importance of Loan Portfolio and Marking Loans To Market
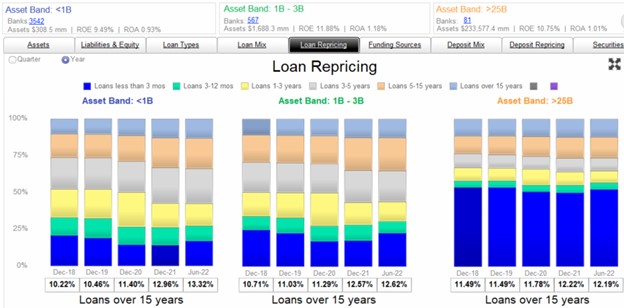
The graph below shows loan repricing buckets for three asset-sized groups of banks: under $1B, $1B to $3B, and over $25B in assets. In summary, smaller banks have a higher percentage of fixed-rate loans than larger ones, as noted by the black-colored brackets. The percentage of fixed-rate loans has increased for community banks over the past four years. In contrast, larger banks have more loans in the variable bucket, and their fixed-rate loan portfolio has held steady in the past four years.
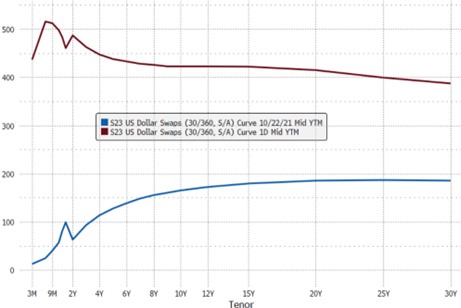
The graph below shows the change in interest rates across the entire curve over the last year. The biggest increase in rates is at the short end (4.20% increase over one year for 2-year rates), and the smallest increase is at the long end (2.03% increase over year for 30-year rates). It is the level of rates and the shape of the yield curve that impacts the value of loans that can be revealed when marking loans to market.
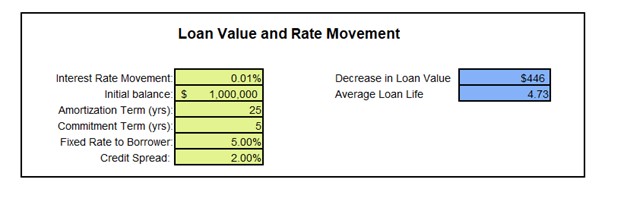
Each basis point increase in rates decreases the lifetime value of a fixed-rate loan to a bank. Marking loans to mark would be the same process as the AOCI for fixed-rate securities. The longer the fixed rate, the more sensitive the loan is to negative economic adjustment. The output below shows the economic value of a one basis point increase in the cost of funds for a 25-year due five-year fixed rate loan. That value is $446. We can calculate that value for different structures.
We can further calculate the AOCI for various term fixed-rate loans based on interest rate movement over the last year. The table below shows the negative AOCI when loans when marking loans to market of various fixed-rate loans with different contractual terms given interest rate movements over the past year.
| $1mm Fixed Rate Term Loan (25yr am) | Loan AOCI Adjustment |
| 2yrs | ($81,060) |
| 3yrs | ($104,574) |
| 4yrs | ($120,834) |
| 5yrs | ($139,532) |
| 7yrs | ($162,641) |
| 10yrs | ($202,055) |
| 15yrs | ($249,133) |
| 20yrs | ($527,370) |
This table shows that a $1mm in principal, 25-year amortizing loan, with now a five-year maturity, in the last year, recognized a negative AOCI of approximately $140k, and the economic value of that loan is $860k (a 14% reduction in economic value). A $1mm in principal 20-year maturity loan in the last year had a negative AOCI of $527k (a 52.7% reduction in economic value). Note that this reduction of economic value dwarfs the current credit spread movement that we have seen. Spread movement has been on the order of about ten basis points over this time period. Spread movement we point out, that is largely driven by higher interest rates.
Marking Your Loans To Market
Most bankers will be surprised to learn of the amount of economic reduction in loan value with fixed-rate coupons under increasing interest rates as a result of marking their loans to market. Further, most bankers will point out that these fixed-rate loans protect the bank when interest rates are falling, as they may do in the future. However, that is not what happens empirically.
Because few of these term loans have prepayment provisions, and almost none have enforceable prepayment provisions when collateral is sold, when interest rates fall, the vast majority of credit-worthy borrowers simply refinance their loans. This has been the pattern in almost every decreasing interest rate environment. The upshot is that banks are creating negative convexity in their loan portfolio – allowing borrowers to refinance fixed-rate loans when rates are dropping and getting reduced economic value on fixed-rate loans when rates are rising. As a result, banks experience sub-optimal loan performance that they never see and often don’t correct for.
Now, you may not want to actually be marking loans to market and running the result through the income statement, but the concept holds. If bankers did see the current mark value of their loans we contend they would be much more reactive to interest rate, credit, and liquidity risk. The result would be a more proactive bank and a bank with not only better loan performance, but better bank performance.