Higher Rates – Faster for Longer

In the last 12 months, the Federal Reserve went from arguing that inflation was a transitory phenomenon to raising interest rates to fight runaway inflation by three percent in just six months. The result is not only higher rates but the most severe interest rate hiking cycle in the past 35 years – and it is not over yet. Banks must plan for the possibility of high inflation and rising interest rates, not just for the next few years but perhaps for the remainder of the decade. This rapid change in interest rates requires careful planning, product selection, and new lending and deposit-gathering strategies.
Higher Rates Due To A Suprised Fed
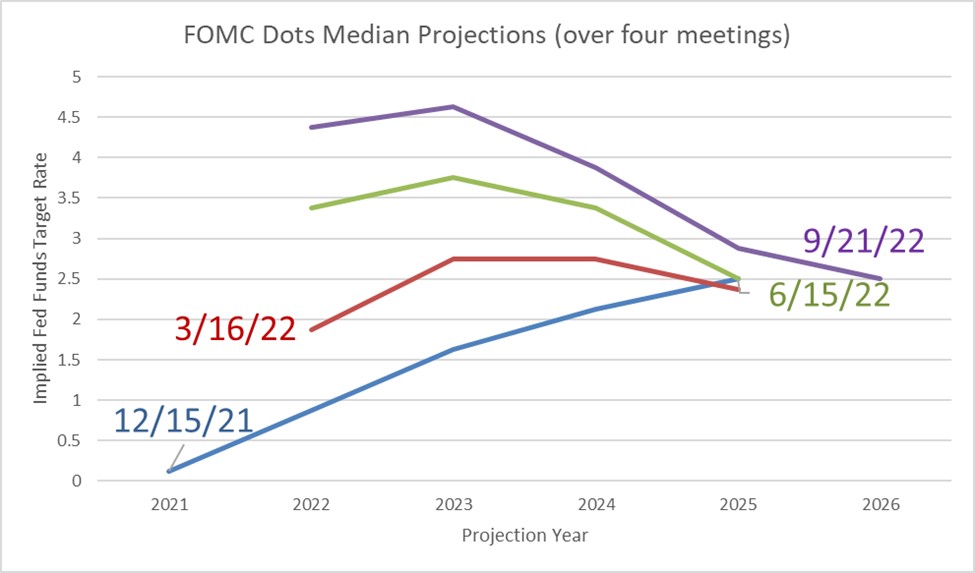
Despite assurances that inflation will not be a problem – when many trillions of dollars of monetary stimulus from the Federal Reserve meet many trillions of dollars of fiscal stimulus from Congress, the inevitable outcome is severe and persistent inflation. The graph below shows the FOMC’s implied Fed Funds target rate from four consecutive meetings. As can be seen, they underestimated the probability of higher rates, as in common in almost every past hiking cycle. The FOMC members revised their end-of-2022 Fed Funds target rate by 3.75% over nine months. We believe that this continued upward revision is not over.
The Fed could not control inflation on the way up and tried and failed to bring inflation to 2% over the last ten years. This time, the Fed will have difficulty controlling inflation on its way up.
Speed and Magnitude of Past Rate Hikes in Comparison
As inflation remains at multi-decade highs, the Fed has been aggressive with its interest rate hikes. In the last six months, the Fed increased rates by three percent. In the graph below, we compare the speed (number of months in the bottom axis) and magnitude (percent hikes in the left axis) of hiking cycles over the last 35 years (six hiking cycles in total).
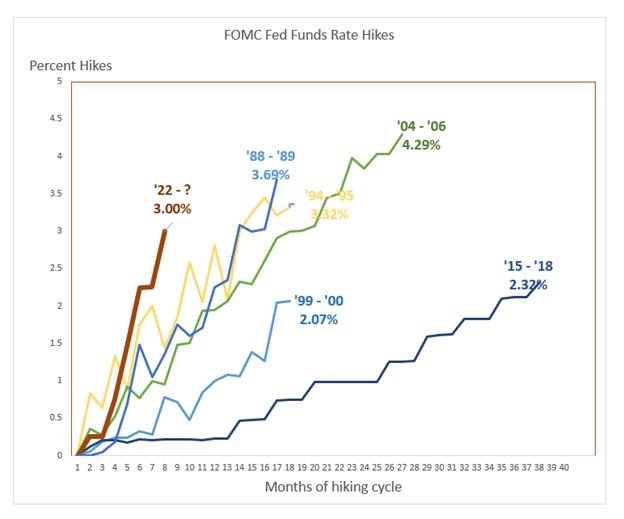
The current hiking cycle is more severe than any other over the last 35 years because, unlike the past five hiking cycles, the Fed is fighting inflation. Further, when the Fed started hiking rates in March of this year, inflation was already at the highest level seen in the past six rate hike cycles. In fact, in the last 30 years, inflation did not exceed the Fed’s 2.00% target through four hiking cycles. Therefore, this rate hiking cycle is faster and more severe than previous cycles because the Fed is fighting inflation and started much too late – both in terms of raising rates and reversing quantitative easing.
Duration of Higher Rates
The table below shows the duration and total change in the Fed Funds rate over the last six cycles (the current one is ongoing). The most prolonged hiking duration is 36 months (December 2015 to December 2018), but that cycle was much less steep than the current hiking cycle.
| Time Period |
Duration |
Total Change in Fed Funds |
| Mar 1988 – May 1989 |
14 |
3.25 |
| Feb 1994 – Feb 1995 |
12 |
2.75 |
| Jun 1999 – May 2000 |
11 |
1.50 |
| Jun 2004 – Jun 2006 |
24 |
4.00 |
| Dec 2015 – Dec 2018 |
36 |
2.00 |
|
Mar 2022 – Sep 2022 |
6 |
3.00 |
Based on current projections, the existing hiking cycle will reach 5.00% in the Fed Funds rate in February 2023. Most importantly, because the Fed does not forecast its preferred measure of inflation to reach its 2.00% target rate until 2025, this rate hiking cycle will likely be longer than any of the previous five cycles.
We believe that the real risk is that inflation does not meet the Fed’s 2.00% goal until much later, and the interest rates remain elevated for longer than the current Fed’s projection of 2026.
Application to Community Banks
While we broke down the seven waves of impact that banks need to be concerned about across the enterprise (HERE), there are several immediate risks from inflation and persistently rising interest rates for community banks. First, banks must be careful to measure and shock interest rates to understand the possibility of debt service coverage ratio (DSCR) deterioration. As the borrower’s loan costs increase, the ability to service the loan declines unless revenues are correlated to interest rates. Unfortunately, most real estate investment businesses, multifamily properties, and many owner-occupied companies do not demonstrate any positive correlation between interest rates and revenue, EBITDA, or NOI. In today’s lending market, borrowers start from historically low interest rates, making the DSCR deterioration much more likely. The average community bank’s DSCR for the commercial loan portfolio is close to 1.25X, and the DSCR for these loans crosses 1.0X with only a 1.50% increase in interest rates.
A second significant risk for community banks is repricing risk. This risk also leads to DSCR deterioration and depletion of borrower equity. On 25-year amortization, very little of the loan is repaid over the first few years. Adjustable loans, or bullet loans, create a repricing event just as cap rates rise and property values fall. This exposes lenders to a shortfall in the secondary form of repayment, as collateral values drop and a borrower’s cost of financing increases with little or no equity in real estate collateral.
Community banks should prioritize credit over pricing, assuming that interest rates remain higher for longer and collateral values fall from the initial underwriting values.