Community Bank Performance – 2Q Lessons

On September 7, 2023, the FDIC released its banking profile. This quarterly publication provides a comprehensive financial results summary for all FDIC-insured institutions (4,645 commercial banks and savings institutions insured by the FDIC). While banks under $10B in assets comprise 97.8% of all banks by number, those same banks comprise only 14% of all banking assets (total banking assets of approximately $26.57T as of Q2/23). Therefore, the quarterly profile and Chairman Martin Gurenberg’s commentary on the industry are skewed by the performance of larger banks. In this article, we analyze the underlying data for community banks and focus on the Chairman’s view of the future of bank performance.
Community Bank Performance
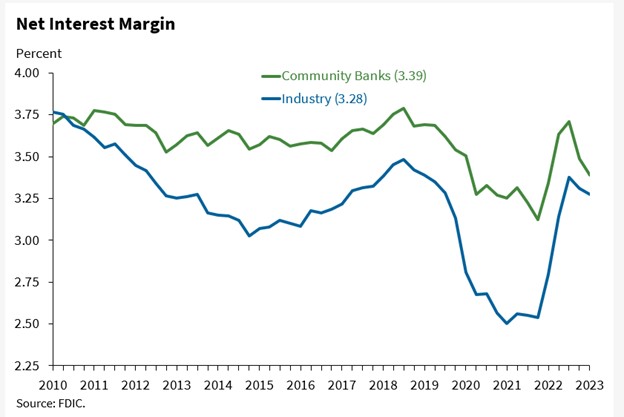
For community banks in Q2/23, net income increased quarter-over-quarter (QoQ) as higher non-interest income and lower losses on the sale of securities offset lower net interest margin (NIM) and higher non-interest expense. Community banks were challenged with increasing deposit costs and a lower increase in loan yield than the industry average, leading to a decline in NIM. The graph below shows that community banks had a bigger decline in NIM (10bps QoQ) than the industry average (7bps QoQ).
Chairman Gurenberg identified the following banking industry risks:
- Effects of inflation.
- Rising market interest rates.
- Geopolitical uncertainty.
- CRE portfolio rollover risk as loans mature and borrowers face higher interest rates (especially for office properties).
While the above-identified risks apply to the entire industry, these risks are not uniform across different bank sizes. Community banks face different and sometimes unique risks.
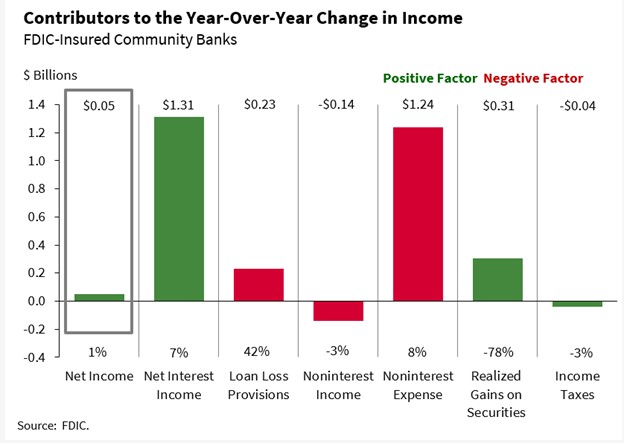
The first major risk identified for community banks in the report is reliance on NIM and lack of fee income. For example, the graph below shows the contribution of various profit drivers for community banks. Compared to the rest of the banking industry (86% by asset size), community banks rely heavily on NIM to generate profit, lack non-interest income, and face higher non-interest expenses (lower efficiency ratio).
The banking industry has historically experienced a lag between Fed Funds and deposit rate increases. This lag can be between six and 12 months, and this hiking cycle will be similar. NIM income is expected to continue to be under pressure as the Fed slows or discontinues interest rate hikes, but deposit betas continue to climb as the monetary policy pass-through continues for at least the next nine months. Further, even without short-term interest rate increases, the Fed’s balance sheet runoff will further pressure the cost of funds (COF) and NIM.
This has been a consistent headwind for many community banks – over-reliance on NIM, lack of efficiency, and underperformance on fee income. The issue facing community banks is not that the business model does not permit lower efficiency ratios and higher fee income but rather the lack of analytics to allow community banks to measure unprofitable relationships.
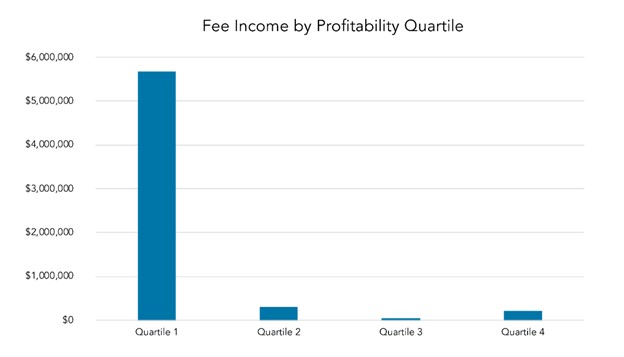
Research performed by numerous analysts demonstrates that the top 20% of the average community bank’s customers make up 120% of profits, and the other 80% of customers are unprofitable for the average community bank. It is also interesting that the same phenomenon applies to fee income. On average, approximately 91% of fee income is generated by the top 1 quartile of customers. PrecisionLender published a working paper on this topic, and their graph below shows an average community bank’s fee income by customer quartile. It is not that community banks cannot generate fee income from profitable customers. It is that they are not attracting and retaining a sufficient number of such customers, primarily because they are not measuring such data.
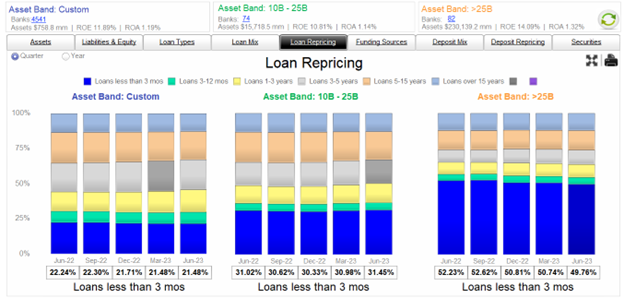
The second major risk identified in community bank performance is longer loan maturities and locked-in lower yields on loans, which is likely to pressure earnings in coming quarters. Community banks report a higher proportion of assets in maturities longer than three years (at 52.9% of total assets). Below is a graph showing loan maturities for three bank asset groups (under $10B, $10 to $25B, and over $25B). Banks over $25B in assets have 65% of all loans repricing within three years, while banks under $10B in assets have only 45% of all loans repricing within three years. We believe that this is largely driven by the use of hedging programs by larger banks and lower adoption of such programs by smaller banks.
The third major risk identified for community banks is above-industry trend loan growth. While the banking industry reported an annual loan growth of 4.5% from the previous year, community banks reported loan growth of 12.5% year-over-year (YoY) – driven by one-to-four-family residential and commercial real estate (CRE) mortgages. Why is loan growth a problem for community banks? There are two main reasons. The first is that this same loan growth is pressuring NIM, by increasing COF through higher deposit costs and higher costs of non-deposit liabilities (FHLB advances). During periods of higher deposit-to-lending ratios, deposit betas become particularly sensitive. When deposit supplies are low, higher lending ratios lead to higher deposit betas, lower NIM, and lower profitability. The second is the issue that we already discussed – the average community bank’s bottom three quartiles of relationships subtract net income and profitability. Without measuring relationship-level performance, three of the four relationships that banks add today will be unprofitable, and new lending relationships will add to funding pressures for the entire loan portfolio.
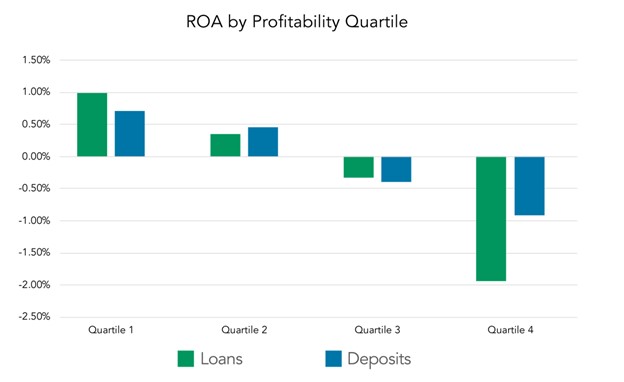
Again, the PrecisionLender working paper summarized this phenomenon with their graph, shown below. This graph demonstrates that the bottom half of loan and deposit relationships have negative return on assets (ROA) for community banks. If banks add relationships when deposit costs are rising faster than loan rates, the ROA for the entire bank is likely to decrease. This is the wrong time for banks to seek unprofitable growth.
Conclusion
The Q2/23 FDIC quarterly financial results and the Chairman’s notes are interesting, but community banks must focus on their unique challenges. We deduce that managers who are looking to improve community bank performance need to focus on the following tools and strategies in addressing likely headwinds:
- Increase sources of fee income and the number of relationships at the bank that can generate fee income.
- Improve bank efficiency ratios primarily by pursuing larger and deeper relationships.
- Measure relationship-level performance to serve and cross-sell top customers and seriously consider shedding relationships that cannot be made profitable (even if it means shrinking the bank).
- Adopt a hedging program that can work for the bank and its profitable customers.
- Pace growth and instead focus on existing clients that can be renewed or restructured into more profitable relationships.
- Get ahead of roll-over risk on CRE credits so that existing borrowers repricing into higher interest rates do not cause credit issues.