How Loan Size Impacts Commercial Loan Profitability

Several measurable factors drive loan (and, by extension, bank) profitability, including loan size, credit quality, term, cross-sell, and upsell. In this article, we will consider how and why loan size is one of the most significant drivers of profitability for community banks and what community banks can do to improve performance.
Relationship Between Loan Size and Profitability
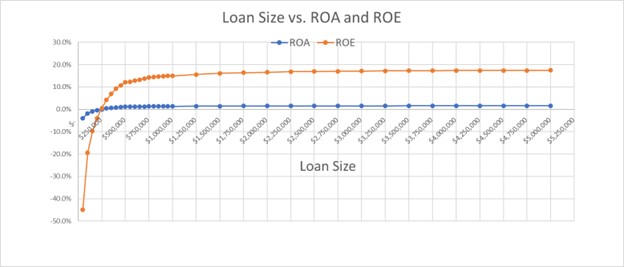
Four primary factors drive the relationship between loan size and return on assets (ROA)/ return on equity (ROE). The first factor is that commercial loan underwriting is a fixed overhead cost business. It takes almost the same upfront costs (source, underwrite, approve, document, and fund) to originate a $250k commercial loan as a $5mm commercial loan. Because of thin margins and high origination and maintenance costs, loan size is a significant driver of performance, and a $5mm loan has 20 times the revenue base of a $250k loan.
We show this relationship in the graph below, where we priced an owner-occupied commercial real estate (OOCRE) loan for an average community bank (average cost of funds, acquisition, and maintenance costs) and varied the loan size between $50k and $5mm. All other parameters (credit quality, spread, fee income, cross-sell opportunity, amortization, term) stayed the same. The relationship between loan size and ROA and ROE is shown in the graph below.
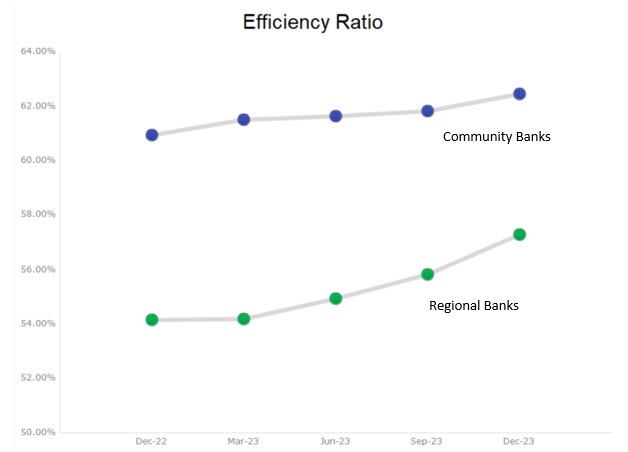
When we analyze the same size/ROA relationship using banks’ efficiency ratios, it is not surprising that community banks (under $10B in asset size) have, on average, a 5% higher efficiency ratio than regional banks ($10B to $50B in asset size) as shown in the graph below.
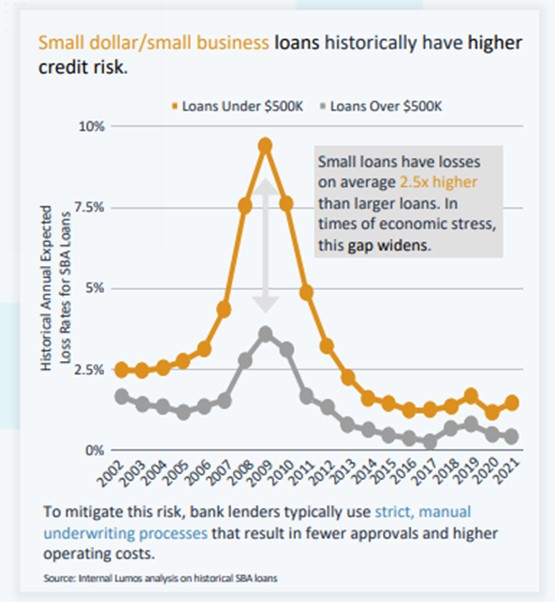
Credit quality is the second factor driving the relationship between loan size and ROA/ROE. Larger loans have lower credit risk, all else equal. The graph below compares SBA loan losses for loans under and over $500k over two decades. This analysis concluded that smaller loans had an average loss rate of 2.5X that of larger loans. There are a few plausible explanations for this phenomenon. First, larger loans are made to larger companies, and larger companies typically have more access to liquidity and capital, making them more credit-sound. Second, larger companies have more diverse management talent to help them navigate recessions. Third, and probably most importantly, larger companies have been around longer and thus have grown to that larger size. These larger companies have already withstood the test of time and have survived business downturns, and the market has validated their business models.
Cross-sell opportunities are the third factor driving the relationship between loan size and ROA/ROE. Larger loans are made to larger companies that require more banking services, including treasury management, demand deposits, international services, lock boxes, and hedging. Cross-sell opportunities, especially demand deposits in today’s market, can double the ROA/ROE on an average-sized commercial loan.
Relationship banking is the fourth factor driving the relationship between loan size and ROA/ROE. Relationship banking involves commercial officers who can add valuable insight to clients through industry, market, product, and pricing knowledge. To provide relationship banking, the commercial relationship manager must spend time understanding his client’s business and local and national trends. The average top-performing commercial lender cannot focus on more than 15 to 50 relationship accounts (depending on the business generated, the efficiency of the bank, and the average loan size). However, a community bank’s average commercial loan size is between $250k and $500k. Because of the small average loan size, community bankers are expected to manage between 100 and 150 accounts to support salaries and overhead at the bank. The commercial banker does not have the time and resources to manage clients as relationships and becomes an order taker.
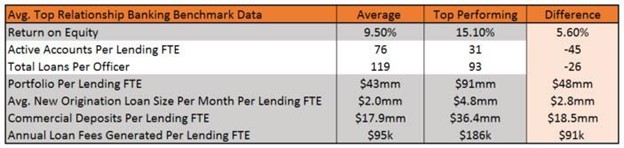
We surveyed 20 self-reported relationship-driven banks over three quarters and compared those banks’ performance to an average community bank. Some of the results are shown in the table below. In summary, these relationship bank lenders handled fewer loans, and had higher loan outstandings, higher loan production, higher deposits, and more fee income – translating to higher ROE.
We are not making the argument that all community banks should become relationship-driven institutions in the true definition of that business model. Still, we point out that if community banks can deploy that model with some existing capable and senior lenders, and if larger relationships are available in their markets, the results may translate to better bank performance.
Conclusion
The 80/20 rule applies to relationship profitability and to commercial relationship portfolios. The 20% larger and more profitable loans in the average community bank’s lender’s portfolio generate about 80% of the revenue and profitability. It is those larger loans that drive profitability for the community bank. Community banks should focus efforts on decreasing the average number of loans in senior lenders’ portfolios and increasing the average size of those loans. We found that the average size loan in a national bank’s portfolio (including only small business lending but excluding corporate and middle market lending) was $4.2mm. While community banks do not need to achieve that same average loan size as the national banks, any effort to grow the average relationship can translate to a substantial increase in ROA/ROE.
Should you need help adjusting your loans to loan size, cost, future interest rates, or structure, be sure to consider a risk-adjusted relationship profitability pricing model such as Loan Command. At approximately $89 per person per month, the model pays for itself multiple times by pricing one loan more efficiently.