Bank ROE – What Should Be Your Bank’s Target?

The banking industry’s return on equity (ROE) was 14.42% as of Q1/23 and so far is looking materially lower for Q2/23. How should community banks target and compare their ROE to the industry and their peer group, and what defines a top-performing bank? Most importantly, is there an ROE level ensuring a bank remains long-term independent and healthy?
Bank ROE Historical Performance
Total assets for all FDIC-insured institutions was $23.7T as of Q1/23. Community banks (assets under $10B) composed 14.3% of industry assets but represent almost 97% of the number of banks in the country. There were only 160 reporting insured institutions in Q1/23 with over $10B in assets. The graph below shows the quarterly ROE for all community banks from 1984 to Q1/2023. The average ROE for community banks over this period is 8.55%, and the standard deviation is 4.34%.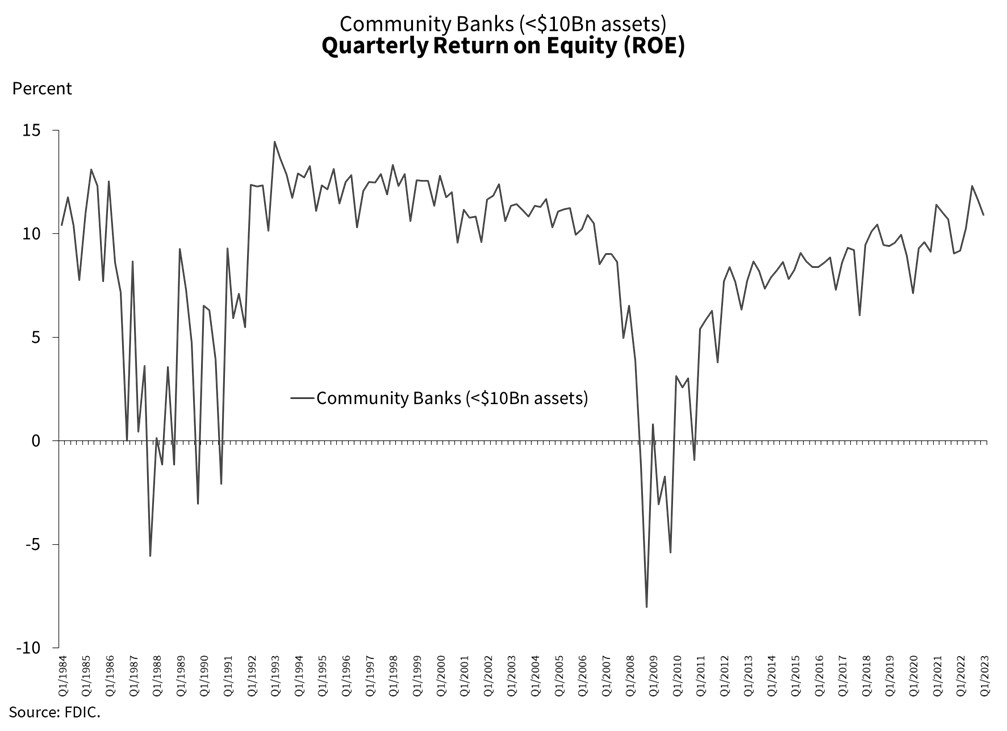
The Required ROE
The “required” ROE for a bank is a complex question, but we will define it as the long-term horizon equity investors require to retain ownership of the bank. A bank investor will measure the return on investment and the distribution of that return (volatility). There are various models investors may use to assess return and risk, but the most widely used is a risk premium model called CAPM (capital asset pricing model). The model calculates the expected return for an asset given the risk of investing in that asset. The model formula appears below:
Expected return = risk-free rate + (asset beta X (market return – risk-free rate))
CAPM allows us to measure the expected ROE that investors demand to retain bank ownership. Studies have generally demonstrated that the US banking industry’s cost of equity is between 8.8% and 11.9% in the long run. However, we will refine and calculate the cost of equity for community banks using CAPM. The 10yr Treasury (currently 4.00%) is the general measure of the risk-free rate. The market return minus the risk-free rate is also called the market risk premium and can be approximated by the S&P 500 long-term return (10.2%) minus the 4.00% risk-free rate.
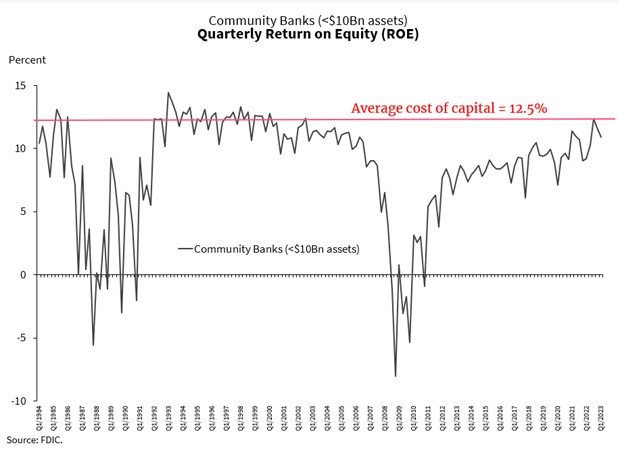
The final number is the asset beta, or the community bank’s stock risk (volatility of returns) relative to the overall market. The KBW Nasdaq Bank index’s long-term beta is 1.12. However, the community bank beta over the long term is approximately 1.41. This gives us community banks’ required ROE of 12.50%. That means that banks that can generate at least 12.5% ROE will compensate investors for the risk of holding the investment in the bank. The relationship between actual returns and cost of capital for banks is shown in the graph below. There are very few periods, especially in the last 20 years, when community bank ROE exceeded the investor’s required return or the bank’s cost of capital. This is one factor to explain why our industry continues to shrink in numbers.
Refinement of Bank ROE Targets
CAPM is a measure of an investor’s required return, given the risk of that investment. However, community bank investors may have other measures of required return aside from CAPM. For example, some investors have intergenerational investment time horizons, which may lower a community bank’s cost of capital. The inputs we used for CAPM are mostly backward-looking, and community investors may have a different forward-looking assumption that lowers their required ROE. Some investors may be measuring return not based on ROE but on pride in ownership, involvement in the community, or managerial/board involvement with the bank. These intangible factors can also lower the bank’s cost of capital.
We also need to assess future shifts to use CAPM correctly as a forwarding-looking tool. While CAPM shows that community banks’ cost of capital is 12.5%, we need to identify factors or uncertainties that may change the cost of capital in the future. The more stable the net income stream, the lower cost of capital is required. Conversely, the more volatile a bank is, the higher ROE is required. Thus, a diversified earnings stream, more reliance on steady fees instead of margin and credit, above-average margins, and a history of innovation can all lower a bank’s required cost of capital.
In addition to stable earnings, investors look at the following risks or exogenous shocks to adjust their required ROE:
- Policy changes. This is a big risk in banking as the industry continues consolidating, and systemically important financial institutions are perceived to be more stable. Regulatory/government policies are difficult to predict, but if public policies favor the trend of continued industry consolidation, the competitive landscape may change. This poses both opportunities and threats to the community banking sector.
- Product and technology changes. New and changing products and technologies create more risk, especially for smaller institutions that cannot adopt or scale for these changes. Again, this may create both opportunities and threats for community banks.
- Financial crises. Because of its financial leverage, and prudential oversight, the banking industry is vulnerable to loss of confidence, liquidity, and capital. The perceived smaller bank risk will drive community banks’ required ROE higher.
Conclusion
To compensate investors for their capital and create positive shareholder value, historically, community banks needed to generate 12.5% ROE. Banks under $10B in assets, as a sector, have rarely been able to generate this minimum ROE. However, this cost of capital is likely to rise as apparent policy changes and technological changes create a riskier environment for smaller institutions. Nonetheless, well-managed community banks will be able to outcompete both in-sector competitors and larger banks, earning substantial returns over their cost of capital.