The Term Structure of Rates and Its Impact on Commercial Borrowing

Bankers need to consider the term structure of rates, also known as the yield curve shape, when structuring and pricing commercial loans to maximize return and reduce risk. Many bankers and borrowers are convinced that a recession is imminent, but the current term structure of rates does not necessarily establish this conclusion. The yield curve’s predictive power is not causal; instead, there is a weak relationship between short and long-term rates, and it is not just the slope of the curve that matters but how it develops and how long the curve is inverted.
Definition of The Term Structure of Rates
The term structure of rates plots interest rates with different maturity dates for the same credit quality counterparty. While swap and Treasury yields are the most frequently reported yield curves, a yield curve can be constructed for any credit counterparty. The graph below shows the spread difference between 10-year bond and 3-month bill rates from 1959 to the present (with recessions in the grey bars).
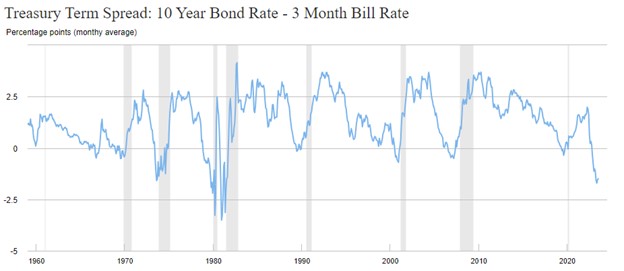
Over the period shown, there are 20 instances of discrete inversion spikes, but there have been only eight recessions. Therefore, the yield curves predictive accuracy is mixed, and to understand why, we need to consider how the market sets long and short-term rates.
During the 19th century and the first three decades of the 20th century, short-term rates were higher than long-term. Only after 1930 did the positive yield curve become more common, and this period coincided with policymakers (Federal Reserve) setting short-term rates. With the Fed setting short-term rates and the market setting long-term rates, the link between short and long rates was broken. Instead of interest rates moving in tandem across the curve, the difference between the view of the Fed and the view of the market on the state of the economy can diverge, creating an inverted yield curve.
Market Forecast – State Of The Economy
The Fed’s actions are countercyclical and often lag the economy. The Fed’s job is to stimulate the economy during downturns and to dampen animal spirits during times of exuberance. Conversely, the market is a forward-looking predictor of the economy and represents the crowd’s collective wisdom. It is not just the inverted yield curve that matters as a predictor of a recession but how the curve develops. Is the Fed hiking rates to the detriment of the future economic potential, or is the market gloomy on long-term economic activity?
The theory of the inverted yield curve is that the market expects significantly lower future growth than the Fed. Thereby, market participants are willing to buy longer bonds at higher prices (lower yields). However, this is not how the current yield has evolved. The Fed increased the short end of the yield curve from just above zero to over 5.30% in less than 18 months. In that same period, the long end of the curve (10-year note) increased from 0.50% to 4.30%. The market’s view of the economy has become much more rosy – to the extent that the 10-year yield has risen by 3.80% in three years. The evolution of the currently inverted yield curve does not necessarily tell us that the market expects a recession but that future growth may be lower than the current expected growth of 5.8% (latest estimate for Q3/23 from Atlanta Fed GDPNow).
When the Fed reacts strongly to unexpected inflation levels (as in 2022 and 2023), a rapid increase in short-term rates can invert the curve as the market participants’ expectation of long-term economic growth potential recalibrates to historical averages (2.5 to 3.5%). Therefore, what causes the inversion may be more critical than the inversion itself.
Conclusion
When the term structure of rates has an inversion in it, it is often a popular recession indicator. However, we must understand the limitations of this indicator. There is a statistical relationship between yield curve inversion and domestic recessions, but that relationship is not causal. How and why the yield curve inverts is a powerful indicator of the probability of a recession. The current inversion is unusual because it is primarily driven by an aggressive Fed, not necessarily by market participants expecting negative growth, and the recent rise in long-term rates is a powerful indicator of the market’s recalibration of the probability of a recession in the near future.