Deposit Behavior In This Rate Cycle – Part III

In two recent articles, we reviewed the banking industry’s deposit behavior with regard to cost of funding earning assets (COF) (HERE), and we compared how community banks’ COF behaves relative to national banks in a rising interest rate cycle (HERE). We demonstrated that the average community bank’s COF is highly correlated to short-term interest rates (mid 90’s correlation coefficient), but every bank’s COF will vary based on how management can optimize deposit betas based on franchise value. We also considered that the Federal Reserve’s fight against inflation would substantially increase short-term interest rates and reduce the Fed’s $9T balance sheet.
The two articles underscored how the pace of rate hikes, the starting point of the hiking cycle, the terminal rate, loan-to-deposit ratios, deposit mix, and online banks’ market share would all affect the industry’s deposit behavior. We concluded that deposit betas would be higher than previously predicted by some models and higher than the industry beta in the 2016-2019 hiking cycle. This article elaborates on our conclusions and shows community banks what analysis they may want to perform to model their specific expected beta. We also offer community banks tools to analyze their historical beta through the last three hiking cycles.
Deposit Behavior In This Tightening Cycle Versus Last Three
The betas for the last three Fed tightening cycles based on bank asset sizes are shown in the table below.
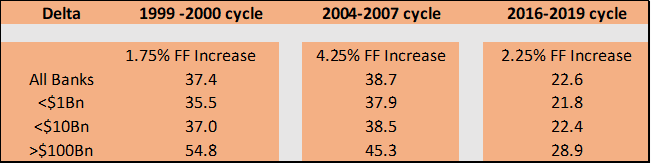
It is essential to underscore that each of the previous three rate hiking cycles was not accompanied by substantial quantitative tightening (reduction in the Fed Reserve’s gigantic balance sheet). The quantitative tightening in 2019 was small (at $50B/mo) and only reduced the balance sheet by $650B. In this cycle, the quantitative tightening was announced at $95Bn/mo and is expected to remove almost all banks’ excess deposits in 2024. The graph below shows the Fed’s balance sheet over time and the projected reduction through 2024.
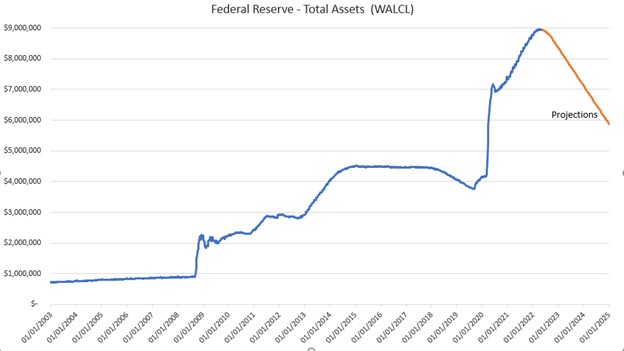
The current projection is that the Fed will remove $3T assets by the end of 2024. The OCC published in January 2022 that the banking system currently holds $3T in “excess” deposits (about 17% of total deposits). Excess deposits are defined as amounts of deposits over and above what would have been the case had there been no pandemic. It is no coincidence that the Fed’s strategy is to remove substantially all of the excess deposits in the banking system over the next two years.
As we wrote in the last two articles, every dollar reduction in the Fed’s balance sheet reduces the reserves that banks hold at the Fed. Deposit behavior is impacted as the reduced Fed balance sheet reduces deposits at banks by the same amount. The counter-argument is that opportunities for higher returns in similar low-risk, liquid vehicles such as Treasuries and commercial paper (held in money market funds) are not available, and consumers and commercial accounts are willing to park funds in bank deposit accounts. But that argument has always been specious – why would returns in Treasuries and commercial paper lag the general capital markets? They do not, and the two graphs below show how T-Bill yields and A1/P1 90-day yields have responded to increases in Fed Funds.
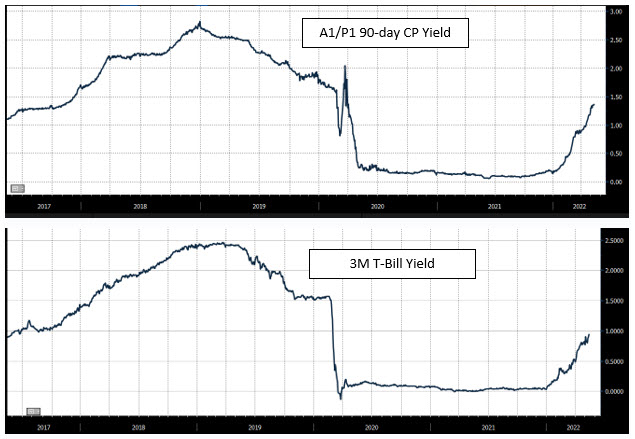
What these graphs demonstrate is that during the pandemic, depositors were willing to forgo 0.00% (or on some days, negative) return on T-Bills, or 0.06% return on commercial paper, but as those returns are rising to 1.00% and 1.40% (respectively), depositors will be tempted to move funds for substantially higher returns with identical default and liquidity risk investments. Even if the level of deposits in the banking system ultimately depends on the public’s preference for holding deposits vs. alternative investment vehicles, those alternative investment vehicles are moving in tandem with increasing Fed Funds rates. In the last tightening cycle, short-term rates reached 1.80% when bank disintermediation pressures emerged. That 1.80% level is expected to be achieved in July 2022. Some banks should expect to see deposit pricing pressures starting in the middle of this year.
How Interest Rates Will Impact Your Bank
We believe that the industry’s average beta might be 40% to 50% in this hiking cycle, but the impact of rising interest rates and a shrinking Fed balance sheet will impact deposit behavior differently for each community bank. Community banks that do not directly compete against national, regional, or online lenders will experience lower betas. Banks with a high number of lower-balance consumer accounts will also achieve lower betas. Community banks that have grown deposits with new accounts vs. increase in account balances are also poised to maintain lower betas.
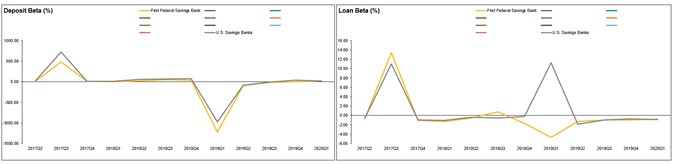
As shown in the graphs below, each community bank should analyze its deposit and loan betas over a reasonable historical period and compare its performance to a peer group.
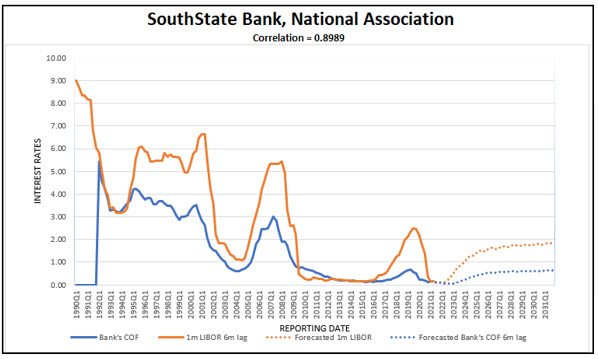
Next, each community bank should first understand its COF correlation to short-term rates and beta through the last three hiking cycles. A graph for SouthState Bank appears below.
After analyzing the information provided above, community banks can determine their preferred mix of deposits and assess desired loan structures. Let us know if you would like us to run this analysis for your institution (without charge).