Here Is the Latest Credit Data To Keep Your Bank Safe

As the risk of a recession gets pushed out by the market, so does the risk of credit. This is not to say bank credit is without risk, as higher rates, inflation, and a slowing economy have taken their toll. Three essential credit metrics – probabilities of default (POD), POD rate of change, and POD volatility- materially increased from 2023. In this article, we look at what is happening at the state level, at 30 common industries where credit risk is rising, and at 30 industries where credit risk is the lowest. This data is critical for pricing, capital allocation, and marketing.
When you write a blog, your work is there for all to see. In 2021, we published articles warning bankers against higher rates (for example, HERE) and the resulting impact on credit. We have seen the higher rates, and now bankers should continue to brace for a credit shock.
Credit Trend Summary
In general, the average probability of default increased by 16.5% from last year, which is slowing down from the 65% jump we saw in 2023. The average probability of default at the end of 1Q was 3.57% in the U.S., or 64 basis points (bps) higher than last year. To put this in perspective, credit usually changes an average of plus or minus 21 basis points each year against a long-term average POD for bank commercial credit of 2.19%.
Credit volatility is also seeing an increase. When liquidity and credit are plentiful, PODs tend to compress, and volatility is reduced. Now, the opposite is happening. As a result, almost every industry became more volatile. As an average, the two standard deviations are around 2.02%. This quarter, it is 3.36%.
Commercial Credit Trends By State
Every state increased its forward-looking probabilities of default on a material basis. The credit risk in California increased the most by 103 bps due to higher inflation, primarily driven by wage costs. As the minimum wage increased to $16 per hour and fast food wages increased to $20 per hour, the probability of default increased partially as a result.
Below is a breakdown by state and their net probability of default increases, year-over-year. The Midwest continues to perform the best, followed by Pennsylvania. As can be seen, Georgia, California, and Nevada have the highest levels of probabilities of defaults and some of the highest increases. D.C. and New York had the lowest increases in credit risk, while North Dakota, Iowa, and Minnesota had the lowest volatility and were the most stable.

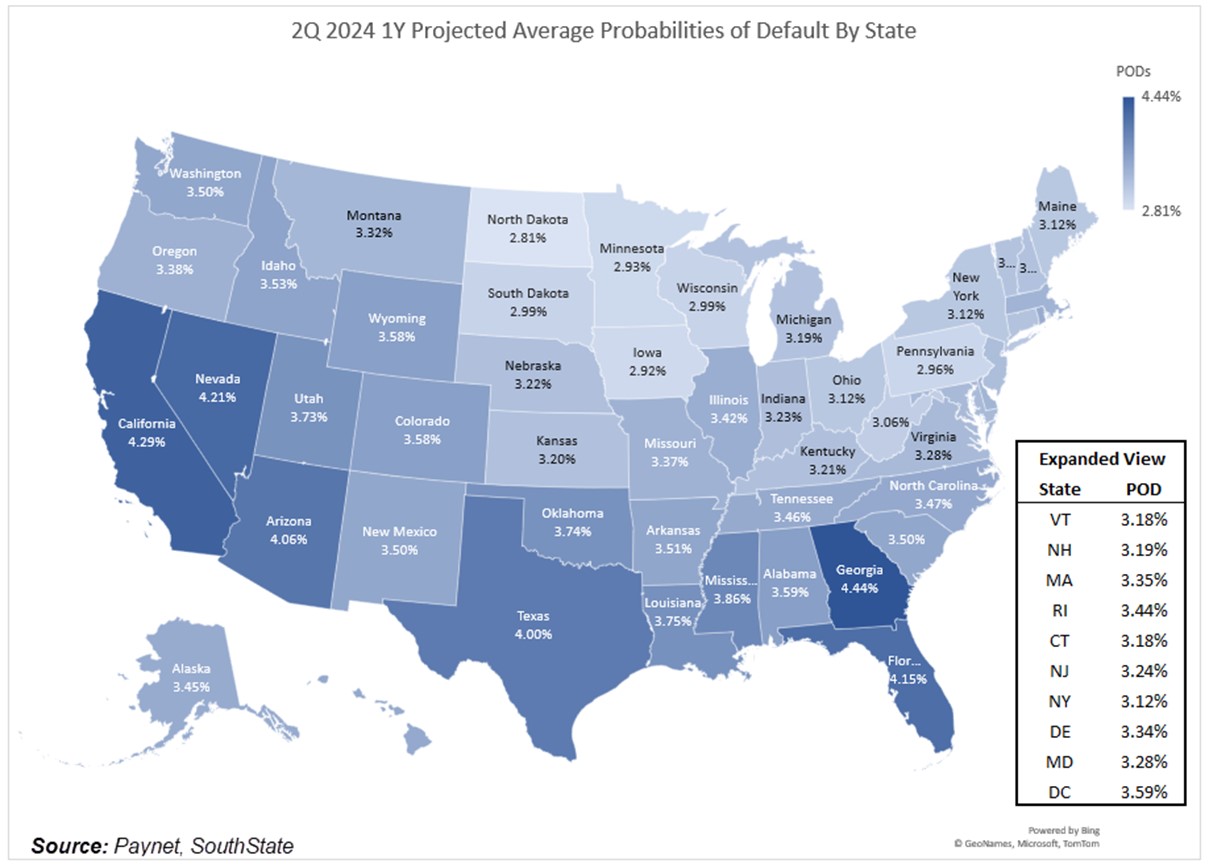
For more details, below are the top 10 worst and best credit risks by state.

Commercial Credit Trends by Industry
Most banks rate the bulk of their credits either a grade of “3” or a grade of “4.” The reality is that banks should be much more granular in their ratings to allocate capital more efficiently. More credit grades allow for a more accurate risk assessment, meaning a more appropriate loan loss allowance level.
The other common problem we see banks making in the second quarter is underpricing credit risk. In good times or times when credit is improving, banks tend to overprice credit risk. However, in worsening times, like now, banks tend to underprice credit risk.
To better understand your credit grading and to see if you are over- or under- pricing, it helps to understand the PODs of your customers. An increase in PODs means an increase in expected losses. Commercial expected losses, considering collateral, went from 81 bps to 106 bps. With the industry’s average loan loss and lease allowance (ALLL) at 1.28%, many banks will find themselves under-reserved on various credit.

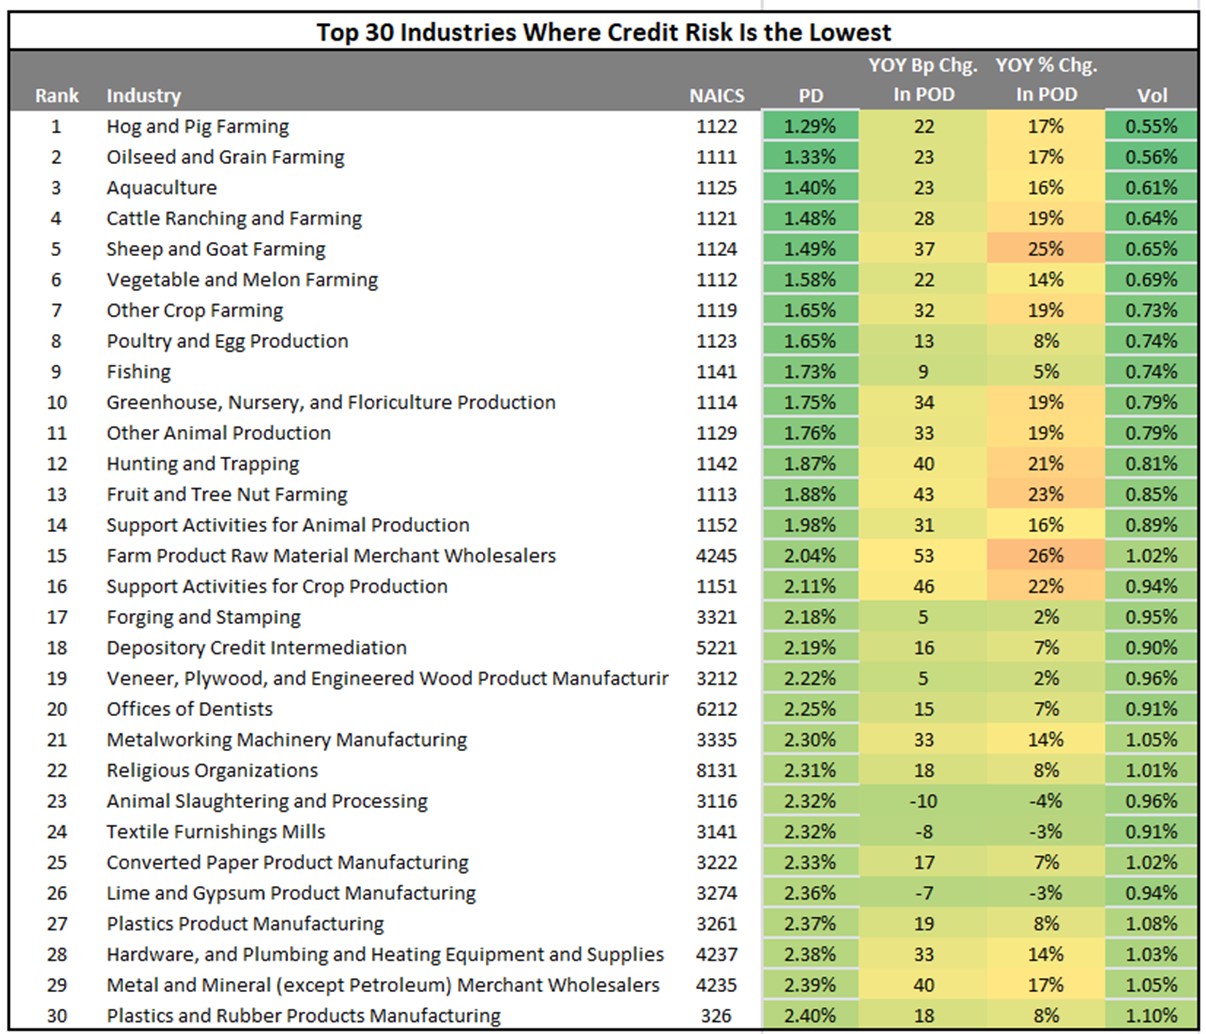
Freight, transportation, and courier services dramatically increased in risk. On the opposite side of the credit spectrum, farming and ranching had the lowest PODs, increased risk the least, and had the lowest credit volatility.
Commercial Credit Trends – Investor Real Estate
While most real estate sectors are increasing in risk, most sectors are undergoing benign prospective increases in the probability of default. Office, of course, remains a considerable concern, given actual occupancy and usage. Investor office jumped to a 2.16% probability of default and will likely double in the next year. Actual defaults, while elevated, have been less than predicted. We are not sure if this is going to last.
Looking at cell phone data, traffic has increased over the last year but within the single digits at most properties, which is not enough to impact lease renewals. As such, office buildings are still undergoing a net operating income (NOI) reset, with the value of the properties dropping in a corresponding fashion.
Multifamily, while the actual risk remains low, is increasing in risk by a factor of three due to the continued supply that is coming online this year in most markets. As such, rent growth should slow, and vacancy rates should increase.
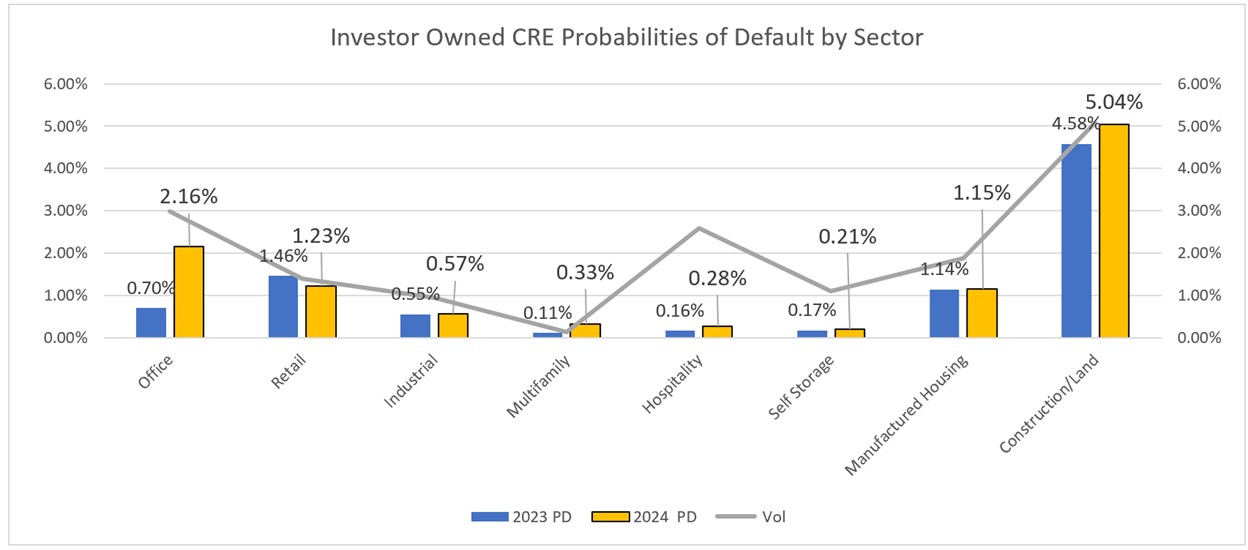
Retail is the other sector worth noting as it is the opposite of multifamily. While many have predicted the physical store’s demise, few lenders have financed new retail property in almost five years. As a result, with the exception of the mall, retail space remains in short supply, and the success of any given property depends on traffic. Thus, while volatility is elevated, diversified retail and specialty retail are predicted to outperform and are the only commercial real estate sectors where the probability of default went down year-over-year.
Credit Trend Ramifications & Loan Pricing
If you use Loan Command, our relationship profitability tool available to any financial institution for $89/month/person, you have all this data live to help you with your pricing and credit decision. Credit for hundreds of industries is included, as well as live rates. We have priced this cheaply so any bank, no matter its size, can afford this valuable tool. If you are not a subscriber, ensure your profitability model considers this significant credit increase.
One material ramification of this data is that loan profitability has dropped year over year. The main drivers have been rising funding costs and higher credit costs, decreasing the risk-adjusted margin. Where last year, the average bank loan profitability was just under 18% (below), the current risk-adjusted return is now just a little over 16% (the second graphic below).
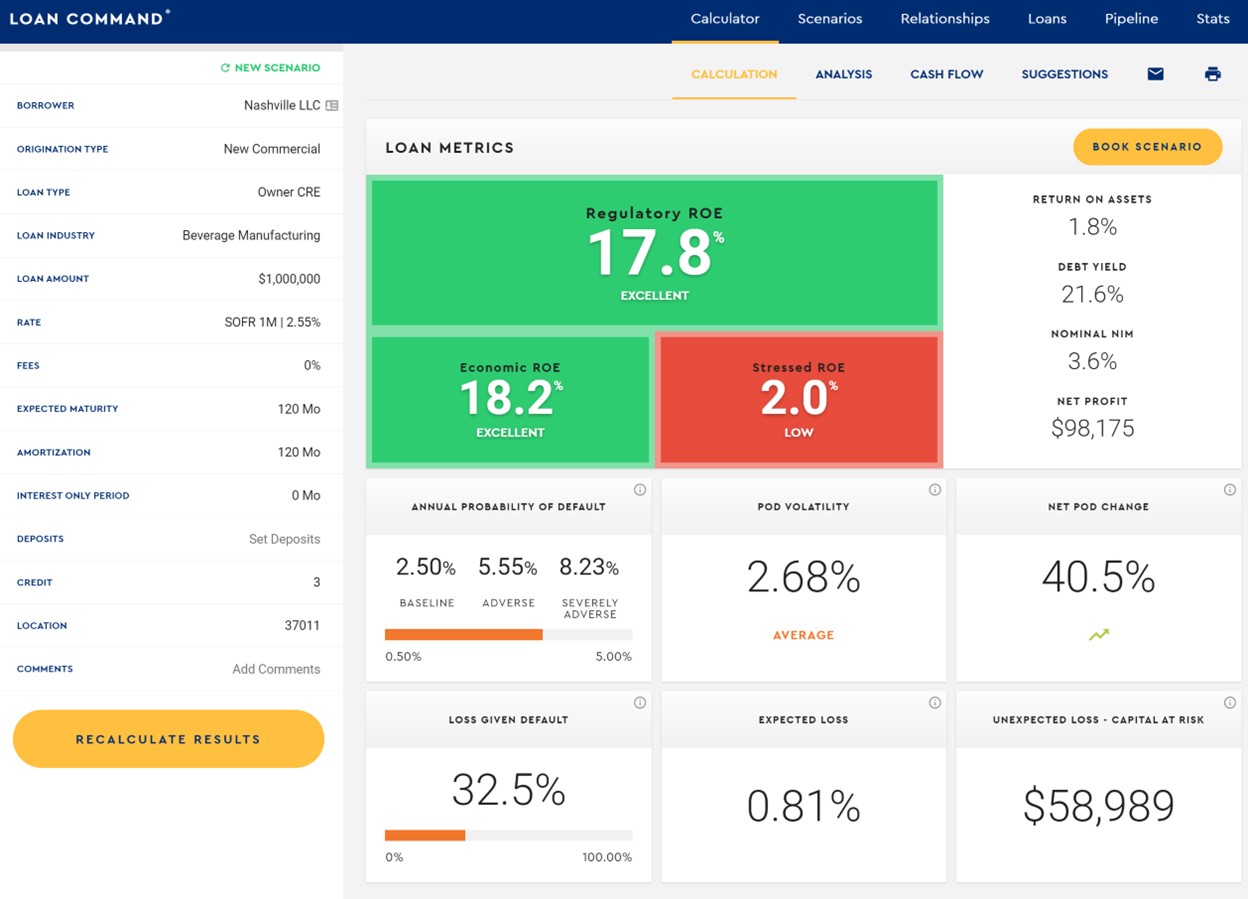
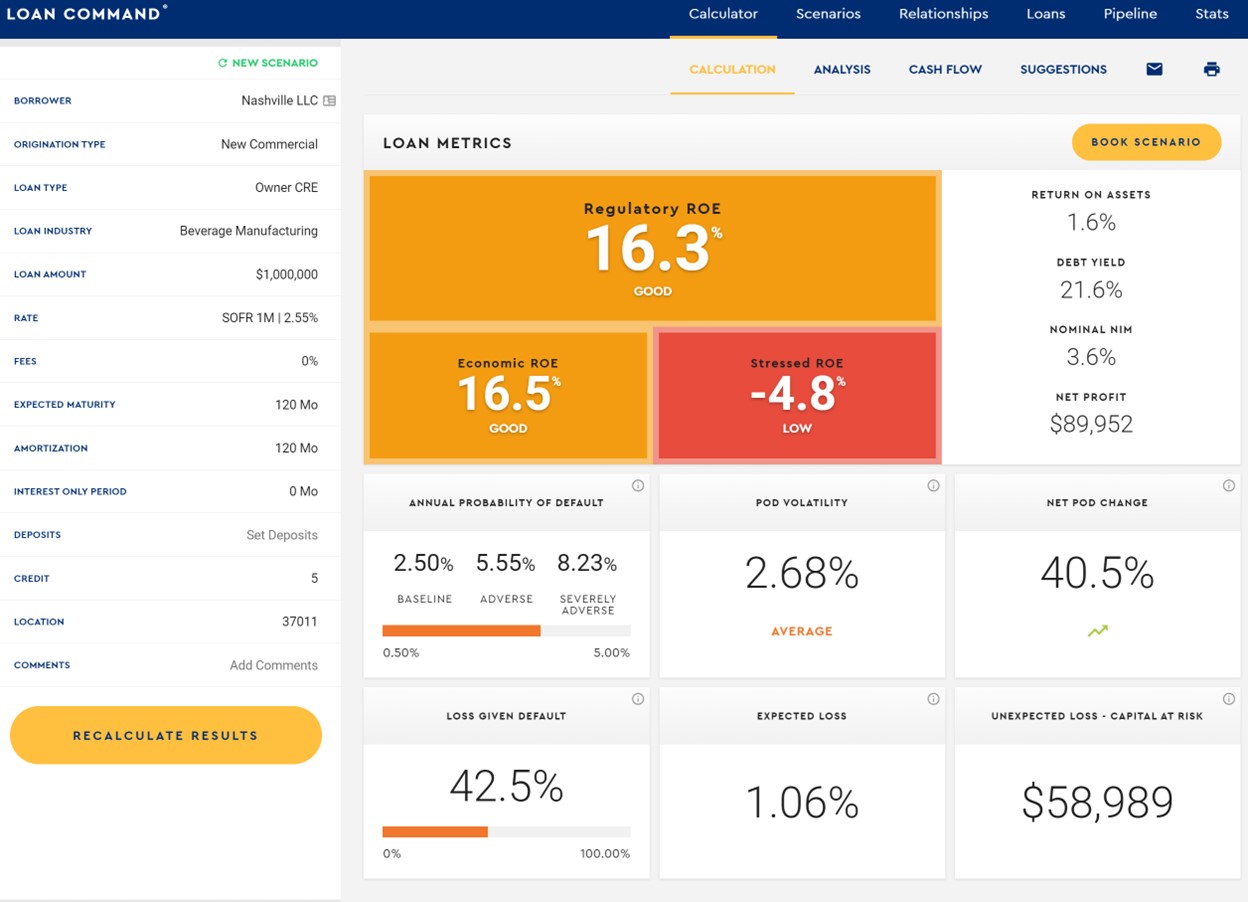
While this is still in healthy territory for banks, it is essential to point out that under a stressed scenario that includes two standard deviation credit shock, the stressed ROE goes negative (the -4.8% above), meaning many banks will have to eat into capital during the next recession by an average of $59,000 per million.
One counterintuitive point that merits contemplation and tactical decisioning is pricing. Typically, pricing needs to increase due to higher credit risk. However, as banks tighten lending (as evidenced by the latest Senior Loan Officer Opinion Survey), banks have stopped lending to many risky sectors. As a result, banks are going after higher-quality borrowers and existing customers where the credit risk is known and low. As a result, pricing for quality credits has continued to stay contracted. For credits below a 2.50% POD, commercial loan pricing has gone from an average spread of 2.48% at the start of 2023 to 2.33% in 2Q in 2024.
While we will publish an update on loan pricing later this month, pricing, in aggregate, has increased from a spread of 2.50% to an average spread of 2.55%.
In terms of structure, as expected, loans with floating rates to borrowers and adjustable loans coming up for reset are now under the most significant credit pressure. In many of these cases, expected losses have tripled as borrowers get hit with the double whammy of increased interest and credit charges.
Fixed-rate loans from the 2020 and 2021 vintage are now performing the best in terms of credit, as many of these loans provide an extra incentive for borrowers to keep making payments. Inflation has likely helped cash flow in these cases while interest cost has remained fixed. Unfortunately, many of these loans have negative mark-to-market positions and are losing money for the bank because of the interest rate risk despite their low credit risk profile.
Of course, banks that extended fixed rates to the borrower and hedged with a floating rate have the best of all worlds. These loans continue to perform at an 18%+ risk-adjusted return on equity as net interest margins have increased due to higher rates. At the same time, credit risk has dropped in many cases (office and multifamily exposure being the notable exceptions).
Putting This Data into Practice
In good times, this data can be ignored. If you are wrong in pricing credit or allocating capital, the impact is likely less than 50 bps of ROE performance. However, when the principal is at risk, being wrong can have terminal consequences.
When borrowers feel stressed, this data is invaluable for pricing, capital, and structuring decisions. The increase in PODs, loss-given defaults, and expected losses mean that banks need to choose their credit and pricing wisely. Getting more granular in credit risk means a more efficient allocation of capital.
Banks are more leveraged than the average hedge fund, and lending decisions have outsized consequences. Equally important, there is a time dimension to credit that is seen in only a few industries. While banks manufacture credit and relationships, it’s not like selling a widget.
You can correct your error the next day if you misprice a widget. When bankers make a credit decision, they live with that credit and that pricing for an average of six years.
While many banks are seeing increased liquidity pressure, credit may geometrically compound that problem. When credit risk starts to manifest on banks’ balance sheets, which it will, banks will experience liquidity pressure, the likes of which they have never seen. This is saying something given the historical quarter we just finished.