NIM and Its Relationship to ROA in Banking

Despite reaching the highest profitability in over a decade in 2022, US banks overall trade at a discount to other sectors as measured by P/E or P/Book, and approximately 53% of US banks have earned less than their cost of equity over the last five years. The high profitability for banks in 2022 was propelled by an increase in net interest margin (NIM), primarily due to rising interest rates as the Federal Reserve embarked on the most severe hiking cycle in the last four decades. However, banks focused on increasing their NIM are unlikely to survive – as witnessed by history and explained by simple logic.
Data Visualization and Bank Profitability
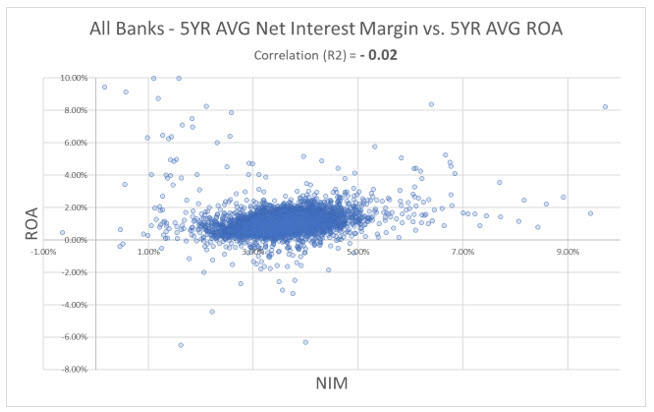
Data visualization allows users to see data quickly, understand it more effectively, and identify which factors influence behavior and the relationship between cause and effect. The graph below shows the 5-year average relationship between NIM and ROA for all banks in the country. The graph and the analysis demonstrate that no relationship exists between a bank’s NIM and performance as measured by return on assets (ROA). The correlation coefficient (R2) between these two variables is NEGATIVE 0.02 (essentially no explanatory relationship). We consistently measure the relationship between these two variables and obtain the same general results. Banks that can generate higher net interest margins are not more profitable as measured by ROA.
While many bankers focus on developing strategies to increase loan yield to widen NIM, we believe this approach is not sound. Loans are not fabricated by banks but are negotiated by borrowers and lenders in a broad, relatively efficient market. The lack of relationship between NIM and ROA results from the other factors that are more important to bank profitability, such as loan credit quality, loan size, and relationship value. Because most community banks do not use a risk-adjusted return-on-capital (RAROC) loan pricing model, the only variable that some bankers focus on is loan yield – the most easily measured variable. However, NIM is one of the least important attributes specific to loan performance and the general profitability of the bank. The market is efficient enough that strong borrowers with sizable credits and those willing to provide a total banking relationship to a lender also obtain lower-priced loans.
The most common rebuttal by community bankers to using a RAROC loan pricing model is that small banks are price takers and need to price to market to win loans. That is a specious argument because a loan pricing model’s primary benefit is not to calculate a loan’s expected profitability but to allow management to make or not make the loan based on ROA calculations – these are two very different objectives.
What Drives Profitability if Not NIM?
If NIM is not a predictor of ROA, what is? Four factors seem to predict banking profitability:
- Specialization leads to profitability – The country’s top 10% of profitable banks are essentially not NIM-focused but derive their superior performance through a focused business model, including captive finance, payment providers, or credit card banks. These banks often have scale, efficiency, and a singular focus. While there is nothing wrong with being a relationship bank for retail and commercial customers, know that it is one of the most difficult business models to execute. It is important to note that while these specialty banks tend to have outsized NIMs, they have outsized NIMs because of their business model.
- Market segments – A bank is a compilation of its customers. Go after profitable customers, and a bank will usually become profitable. Banks that target customer segments such as healthcare, law firms, technology companies, and high-net-worth individuals tend to produce above-average profitability. The other corollary to this concept is customer profitability is not passive. If the rule is to sell more profitable products to more profitable customers, then banks that have higher profitable products per customer will have higher than average profitability. Proactive banks will take a profitable customer segment and cross-sell them more profitable products in order to build superior ROA.
- Location – Because most banks take on the profitability of an area, geography matters. The primary business location is a significant factor for top-performing banks. Banks in rapidly growing counties, states, and regions tend to outperform the industry.
- Operating Leverage – Scale matters. Especially for undiversified banks, having economies of scale helps to increase profitability. For clarity, growth does not equal scale, which is why the quality of growth matters.
Conclusion
By understanding the drivers of profitability, banks can better use RAROC loan pricing tools to increase performance. Instead of NIM, focusing on factors that drive loan profitability, such as credit quality, relationship value, business efficiencies, specialization, and scale, can help community banks thrive. In future blogs, we will dive deeper into some variables that bankers can control and that drive community bank profitability.