Bank Credit Risk: A Risk-Return Analysis

Most bankers are familiar with the concept of risk-return tradeoff, which states that potential return rises with an increase in risk. Low-risk assets pay lower potential returns, whereas high-risk assets pay higher potential returns. Further, some bankers are taught early in their careers that they are in the business of taking risks, and banks would not earn profits without it. While every bank will take some level of credit, interest rate, liquidity, and operational risk, the question is this: Are banks in the business of taking risk to earn higher revenue, or are banks managing relationships and should avoid risk (and the higher return) when possible? Empirical evidence, recent bank failures, and common sense have taught us that many risks do not translate to higher yields. In this article, we’ll consider the risk-return tradeoff for bank credit risk, and in a future article, we will compare different community bank business models.
The Evidence Against Bank Credit Risk
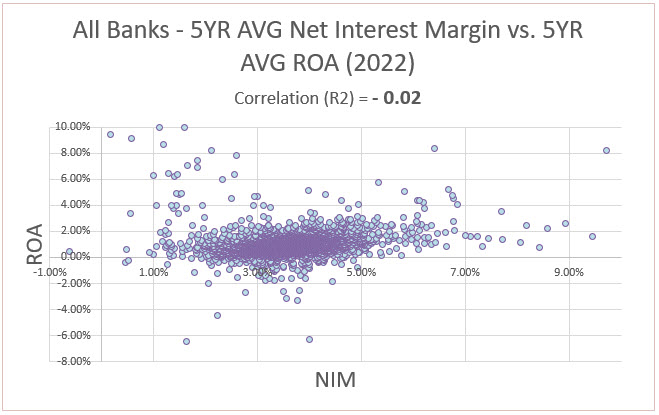
Every year we analyze the relationship between net interest margin (NIM) and return on assets (ROA) for all banks in the country. The correlation between the NIM and ROA between 2017 and 2022 was negative 0.02 (correlation coefficient). This relationship is statistically insignificant and shows no relationship exists between higher NIM and ROA over time. When we consider defunct banks (acquired or failed institutions), the NIM/ROA relationship turns more negative (higher NIM leads to lower ROA).
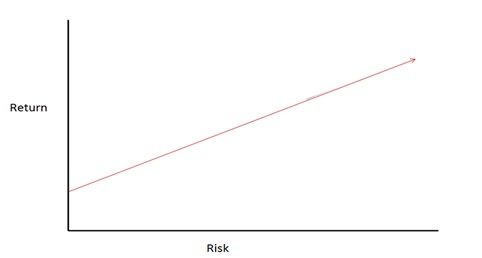
Why is there a low, or possibly inverse, relationship between NIM and ROA? A low correlation between NIM and ROA perplexingly supports the risk-return tradeoff for unforeseen reasons. Bankers that want additional yield may be willing to take additional bank credit risk. By taking the extra credit risk, banks take on more future credit loss and, thus, a lower ROA in the long run. But why are banks, over the long term, not correctly measuring credit risk? If your worldview is that loans are priced efficiently, and your bank is in the business of taking credit risk for yield, then each loan will translate to the same ROA (portfolio effects excluded). Each loan would earn the bank the market clearing ROA. If you believe that bank credit risk is efficiently priced, then the risk-return relationship is shown in the graph below. Each loan is priced on the red line, and in the long run, all banks would earn the same ROA (excluding specific operational differences).
The reality of risk-return for private credit (loans) is quite different. The markets (i.e., lenders and borrowers) are not clearing loan prices efficiently, and many loans are priced above or below the red line. Smart bankers want to get loans above the red line and avoid loans below that red line. Here, the analysis gets more interesting; bankers do not seem to make mistakes evenly above and below the line. Risk-return tradeoff mispricing occurs much more frequently on more risky credits than on less risky credits.
When it comes to bank credit risk, bankers tend to underprice higher-risk loans to a greater extent than lower-risk loans. This makes sense for several reasons:
- Riskier credits have a wider dispersion in performance (the dispersion around the expected probability of repaying is wider), leading to more possibility for mistakes.
- Credit risk is a distant cost, while yield is an immediate gain. Humans tend to favor immediate gratification at the expense of a distant cost.
- Bankers are typically paid incentives for higher yield, but the bank’s shareholders must pay for future credit mistakes. This is a classical agency/principal dilemma.
- Competition is constantly leading us astray in pricing. The old adage in the industry has been that you can only perform as well as your dumbest competitor. If your competition is underpricing credit risk, the borrower is more than willing to take that capital, and your only choice is to lose that loan. It is more likely that some lenders will inevitably make a risk analysis mistake on the riskier loan than the less risky loan (that comes with a lower yield).
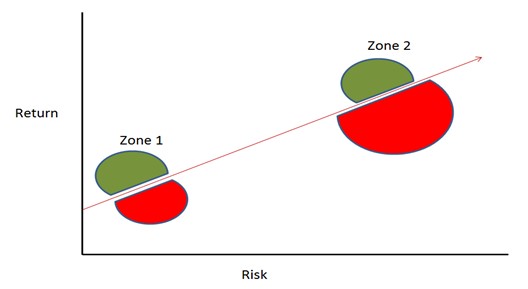
Because of the above factors, the risk-return tradeoff is not a straight line but a set of semicircles like the graph below. Between Zone 1 (less risky credits with lower return) and Zone 2 (higher risk credit with higher return), banks want to land in the green semicircle and avoid the red semicircle. Unfortunately, the red semicircle in Zone 2 is quite large, and many banks get trapped in the game of wanting to outwit the market (gain additional NIM without taking the additional risk to demonstrate higher ROA).
Unfortunately, competing for riskier credits has not worked for most banks in the industry. When we look at the correlation between NIM and ROA across a business cycle (with recessions included), we find that greater NIM leads to lower ROA. The NIM/ROA correlation coefficient is around zero during economic expansions and is negative during credit downturns.
It would appear that bankers would be better off competing for less risky credits because they are more efficiently priced. One obvious reason that certain banks continue to focus on more risky credits is because of operational inefficiencies. These banks cannot make their business model work at lower yields because of overhead costs. However, when it comes to bank credit risk, in the long run, through an economic cycle, the business model of underwriting riskier credits leads to suboptimal ROA.
Conclusion
We believe a bank’s long-term ROA would be optimized by deemphasizing underwriting higher-risk credits and concentrating on operational efficiencies to make the business model profitable with lower-yielding assets. It appears that for the average bank, and in the long run, the risk-return tradeoff for bank credit risk erodes shareholder value. Instead, top-performing banks focus their capital, products, and employees on relationship-building and risk avoidance. In a future article, we will contrast the pay-for-risk versus relationship banking business models to help community banks understand which model best suits their success.