1Q 2024 Commercial Relationship Credit and Pricing Trends

Since our last update on pricing and credit HERE, commercial loan pricing trends for the first quarter of 2024 continue to be driven by the perceived increase in credit risk, tighter credit supply and banks’ need for wider margins. This article provides an update on pricing trends driven by our Loan Command aggregated community bank data and highlights some commercial loan insights that can improve bank performance.
Executive Summary
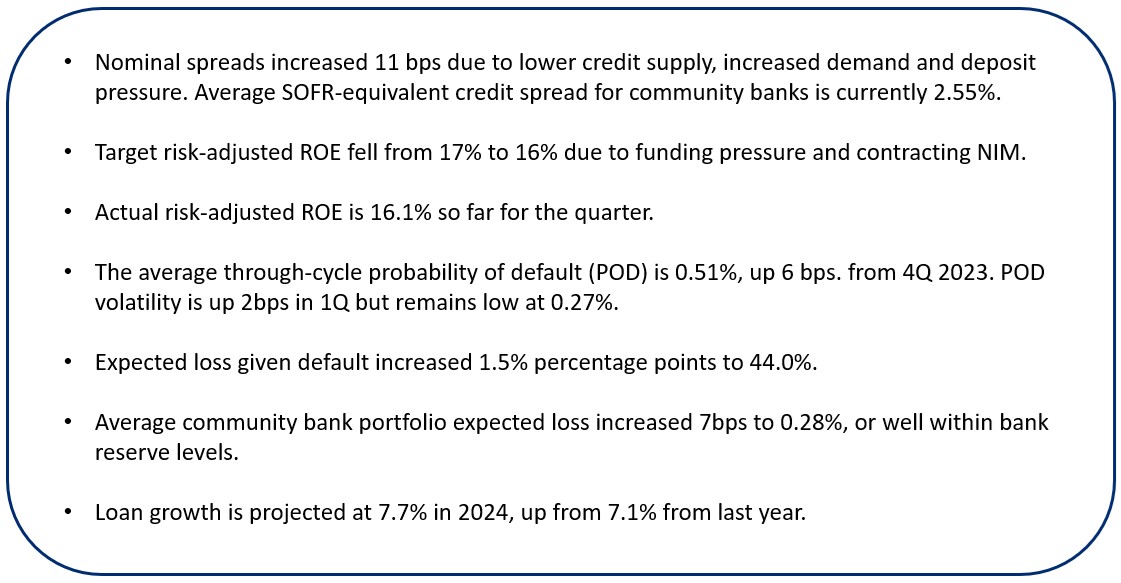
While bank loan pricing is nuanced – if you are looking for a headline number, weighted loan pricing increased for the third consecutive quarter increasing 11 basis points. The average SOFR-equivalent credit spread for loans in 1Q is approximately 2.55%, compared to 2.44% last quarter.
Most of the price increase was driven by two factors. One is credit risk increased slightly. While delinquencies ticked up in most major sectors, the probability of a recession decreased. On a net basis, the probability of default increased 6 basis points (bps) to 0.51%. Higher capitalization rates driven by higher expected future rates (fewer rates are priced in the forward curve) dropped the future value of properties across the United States and hurt expected loss given default (LGD) by 1.5% percentage points bringing forward looking LGD to 44% of the average community bank loan amount.
On a net basis, expected loss projections increased 7 bps on community bank loans. This resulted in modeled projected reserve levels coming in at a suggested 68 bps while most banks remained well-reserved at the 1.25% level.
The other major driver of higher loan pricing are banks’ need to increase margins. As such, many banks instituted higher minimum spreads, higher fixed rates, and rate floors.
Target return on equity hurdles moved down from 17% to 16% driven by higher cost of funds and interest rate sensitivity (impacting higher future cost of funds). As deposit mix continues to change from non-interest bearing to interest bearing, beta continues to increase hurting future profitability.
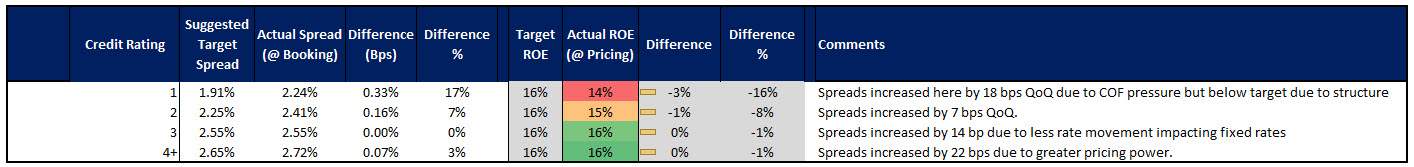
Commercial Loan Pricing By Credit Grade
Below is the current credit trend pricing for the quarter broken down by credit grade. This quarter, banks credit trends include loan pricing that is closely correlated to risk pricing.
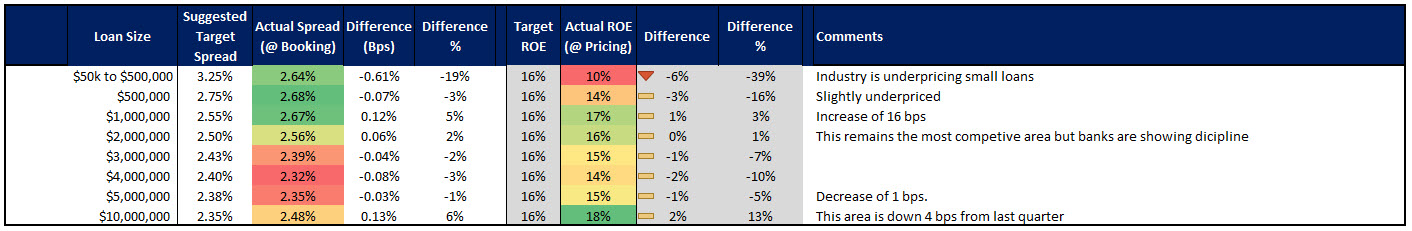
Commercial Loan Pricing By Loan Size
Like last quarter, without consistent Fed hikes and interest rate volatility, banks did a much better job at pricing this quarter. Spread compression in the past occurred around banks quoting and then holding constant fixed-rate loans resulting in near-2% credit spreads. Except in two size categories, most banks priced fixed-rate loans accurately, and we saw fewer free pricing options being given away.
Lower lending growth in key size categories, such as the $1 to $3M range, saw less competition so that banks could increase pricing.
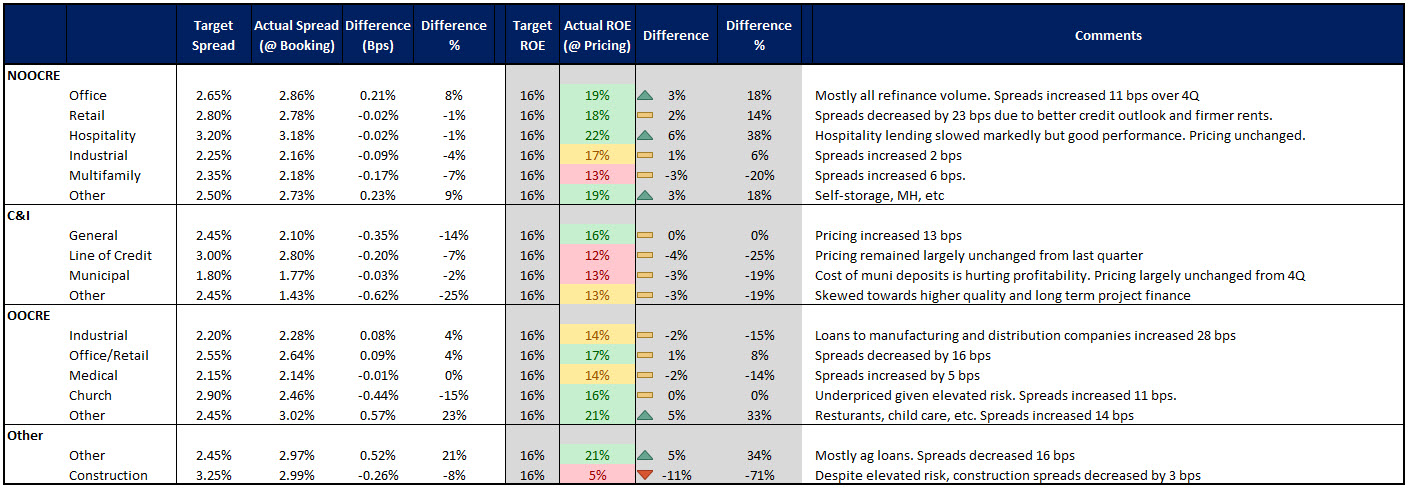
Commercial Loan Pricing by Sector
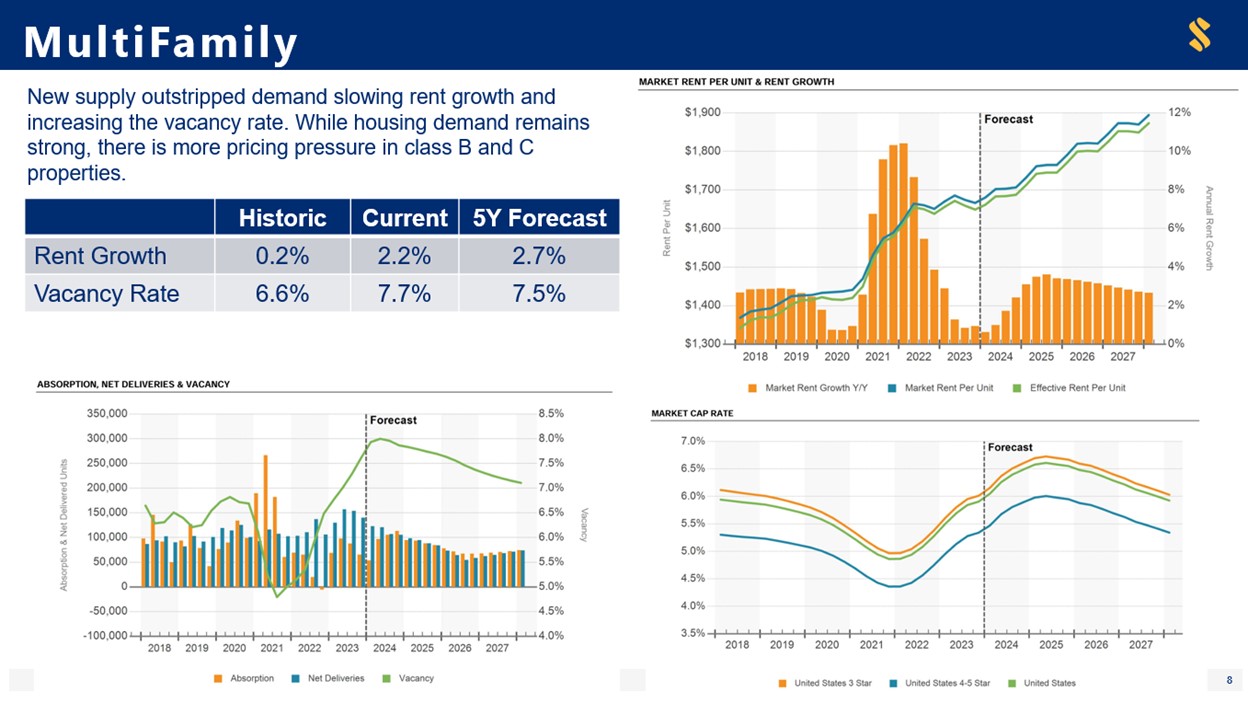
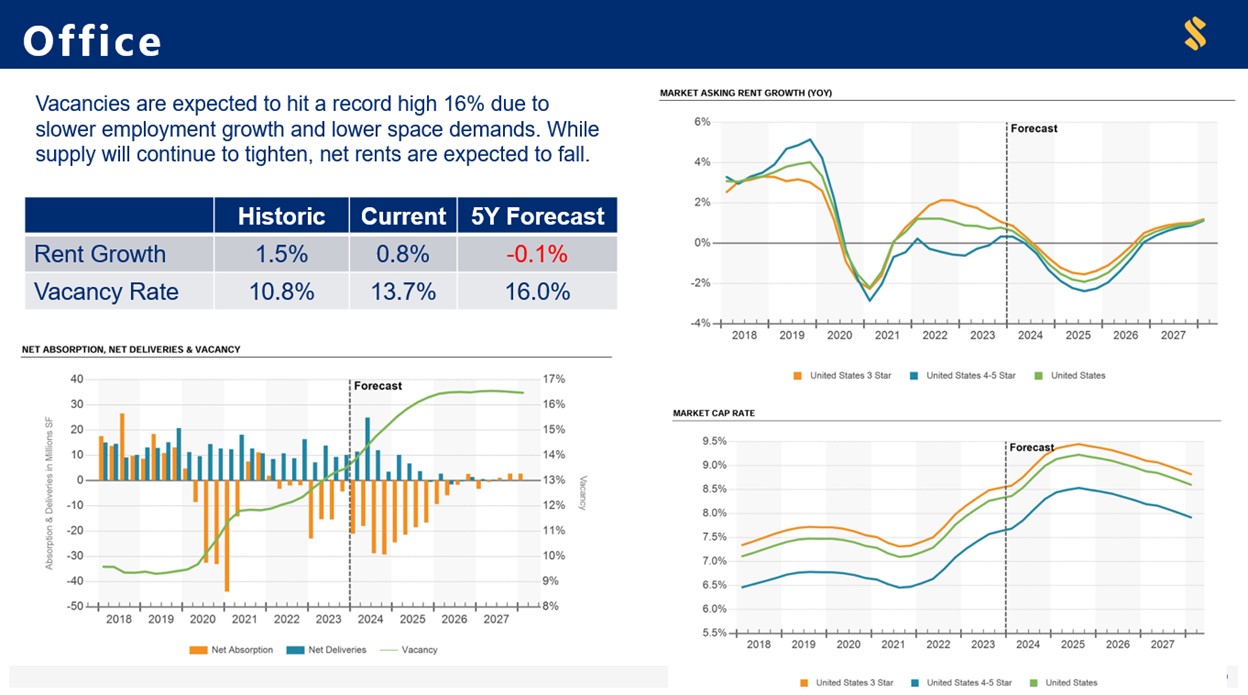
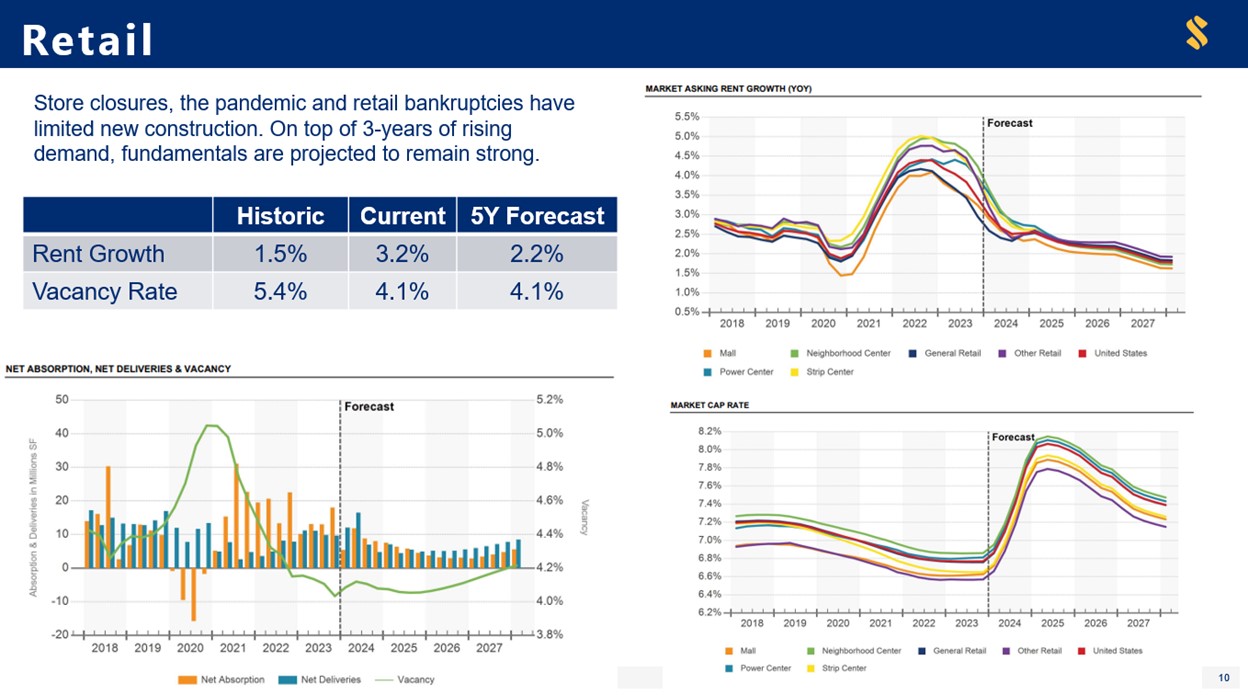
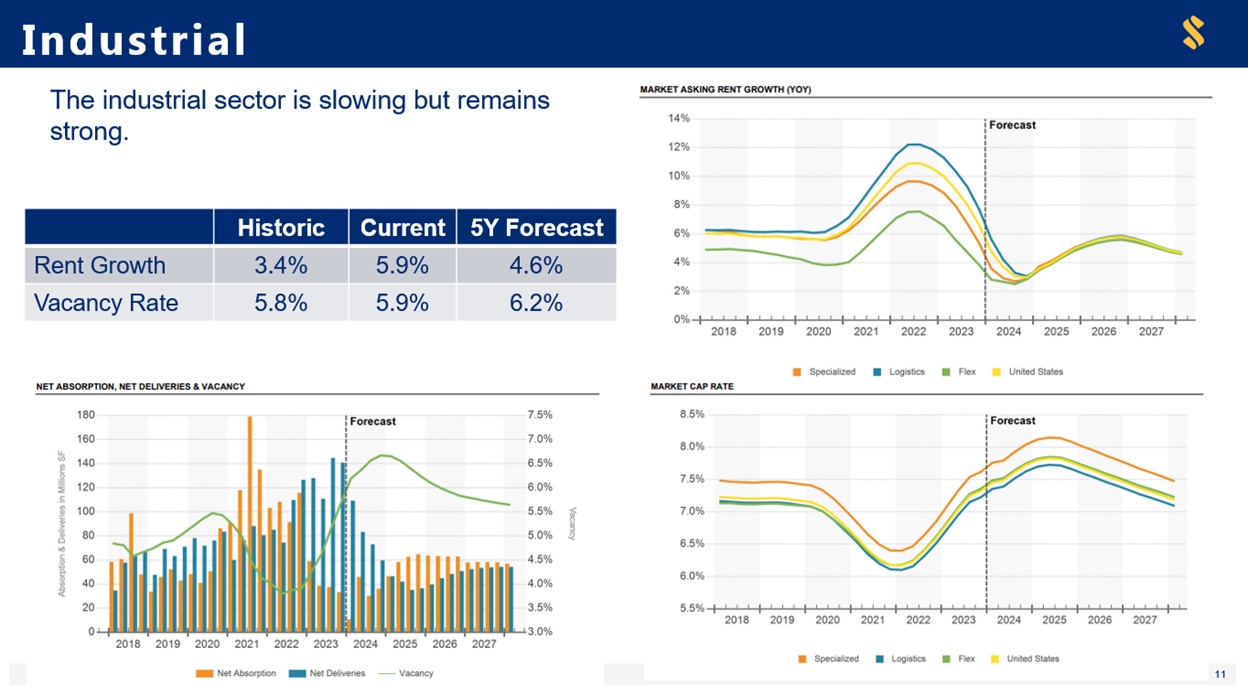
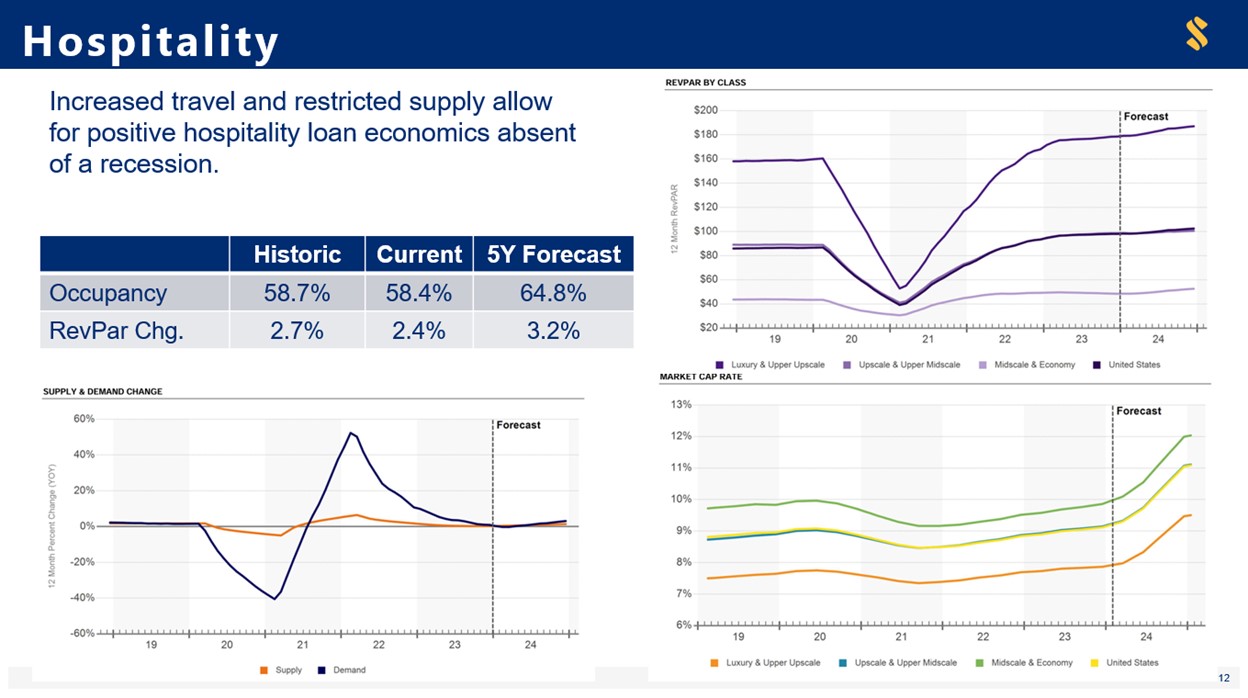
Driven by higher interest rates and lower vacancies, probabilities of default (POD) increased for construction, office, hospitality, and multifamily. The Retail sector probabilities of default decreased as demand for space has increased against a backdrop of tight supply. PODs for the industrial sector remain flat from 4Q at historically low levels.
Demand for commercial real estate (CRE) and commercial & industrial (C&I) loans remains soft while supply remains tight. Banks have loosened up lending for C&I over last quarter, but credit remains constrained.
The above trends of PODs, combined with less competition and lower credit supply, have mainly driven loan pricing up. Construction was the most mispriced sector, while hospitality remains the widest priced (for the moment).
While spreads increased for industrial and multifamily loans, these sectors remained competitive and underpriced. Medical loans had the most significant increase in pricing due to better control of fixed-rate pricing (and less volatility in the market).
Non-real estate C&I loans also saw better pricing discipline from banks with an increase in pricing of 39 bps. In the C&I sector, lines of credit remain costly due to structure and usage. Relatively higher deposit costs hurt municipal deposit facilities.
Commercial Real Estate Loan Credit Trends
Using CoStar data, we arrive at the following analysis.
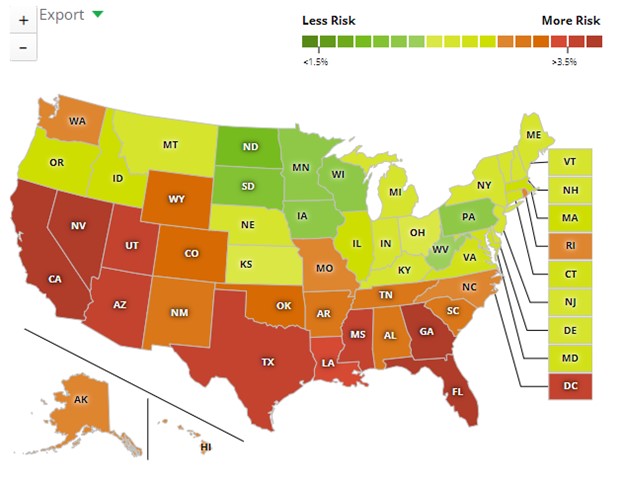
By geography, average forward-looking probabilities of default have increased in the West and Southern portion of the U.S.
Geographic Credit Trends
By geography, average forward-looking probabilities of default have increased in the West and Southern portion of the U.S.
Putting This into Action
A slower-moving and more predictable market has helped banks price relationships more effectively in 1Q 2024 compared to 1Q of 2023. The slower manufacturing of credit and lower demand will continue to put upward pressure on pricing for the rest of this year until the recession picture becomes in greater focus. Banks should continue to pay close attention to PODs, loss-given defaults, expected losses, and delinquency trends to ensure they consider the latest credit data when allocating capital.
Due to the changing forward curve, a wider distribution of credit risk, and slower prepayment speeds increasing duration – community banks are encouraged to utilize a risk-adjusted loan pricing model such as Loan Command. At approximately $89 per person per month, the model pays for itself multiple times by pricing one loan more efficiently.