Bank Product Profitability and Productivity

In our last article (HERE), we highlighted the methodology around why banks should calculate and drive value through customer profitability and product profitability. We focused mainly on customer profitability and used risk-adjusted return on capital as a proxy for profitability. In this article, we wanted a different approach to arrive at the same conclusion but in a slightly different context. Here, we discuss the importance of knowing bank product profitability and productivity.
Bank Product Profitability – Another Approach
In a joint Harvard and Penn State study (HERE) entitled The Cross-Section of Bank Value done in 2021, Mark Egan, Stefan Lewellen, and Adi Sunderam put forth a framework for measuring how various bank products contribute to overall productivity and then overall value in the form of market price-to-book value ratio (M/B).
The authors showcase an example of prior to the Truist merger, SunTrust and BB&T had similar balance sheets. Both banks, for example, had about $150B in deposits. However, SunTrust generated those deposits with about 23% fewer branches and a lower cost structure. As such, SunTrust was more deposit-productive than BB&T. On the other side of the balance sheet, despite having about the same loan footings of approximately $200B, BB&T generated more revenue from traditional banking activities than SunTrust despite having lower levels observable of risk. BB&T was the more asset-productive bank.
As we pointed out, bank management needs to understand how a bank creates franchise value, and one way is to sell more profitable products to more profitable customers. Through this understanding of profitability and productivity, bank managers can set better strategies and tactics plus start to optimize the allocation of capital.
Not All Bank Products Are the Same
One of the main findings of the study is that the liability side drives most of the cross-sectional variation of bank value. The authors find that a one-standard-deviation increase in deposit effort results in an increase in M/B of between 0.2 and 0.8 points. In contrast, a one-standard-deviation increase in asset productivity is associated with only a 0.1 to 0.2 increase in M/B. The takeaway is that banks interested in increasing their market-to-book ratio should consider allocating more resources and capital to deposit products and deposit marketing. In case you missed it and are looking for practical ways to execute this research, we highlighted our top 15 deposit marketing tactics HERE, highlighting our work with the Infusion Marketing Group.
This data begs the question, if deposits are 2x to 4x more valuable than loans, shouldn’t you invest 2x to 4x more for deposit product design, sales, and marketing than loans? The answer is – most likely. While some banks do, many do not. Many banks spend little on deposit management outside of operations while they have a large loan infrastructure, including credit, lenders, loan origination teams, loan operations, and loan management. Many banks have a chief credit officer and a chief lending officer but no chief deposit officer. Many banks have loan and credit analytics teams and tools but no deposit analytics teams or tools.
Getting More Granular
What is more interesting is that the study looks at individual products. Unsurprisingly, savings accounts, with their often low cost of funds and inelastic interest rate sensitivities, generate more value than any other product and have an outsized impact on bank value. As seen in the study’s data below, savings accounts usually generate about 52% of the deposit value and 43% of the market-to-book ratio change, yet make up about 32% of total deposits by volume.
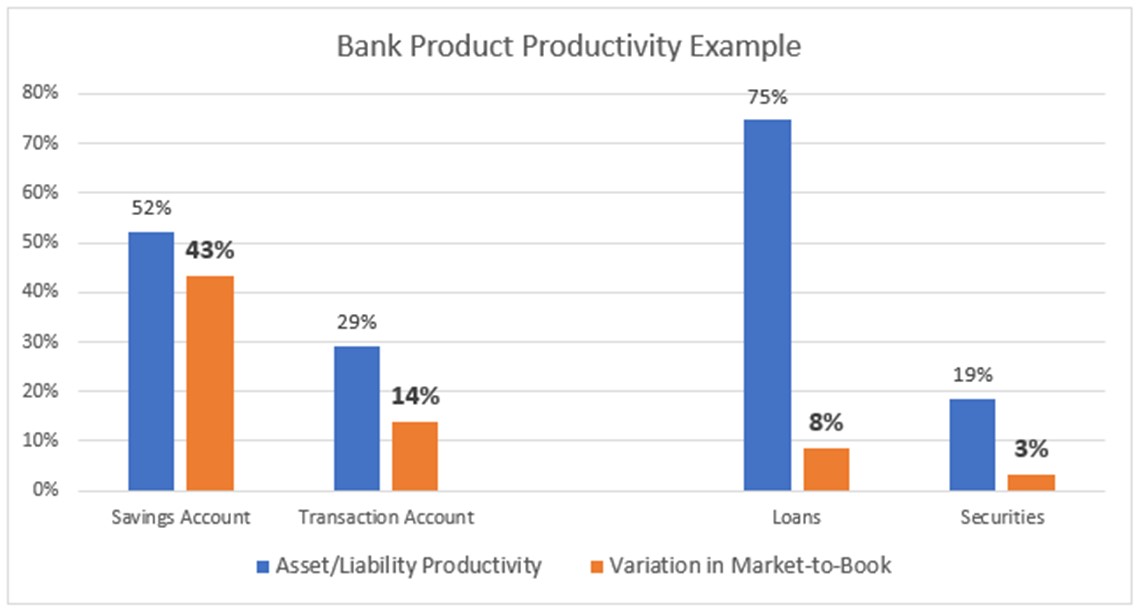
Loans, by contrast, usually drive 75% of total asset productivity but only impact market-to-book changes by 8%.
Putting This into Action
In addition to reorganizing resources to place more emphasis on liabilities and, within liabilities, more focus on business savings, 401k accounts, health savings accounts, and treasury management, some banks need to rethink how they utilize deposits, loans, and securities.
One tactic is to utilize other products to support the main value drivers. For example, since the investment portfolio generates one of the lowest drivers of M/B, the goal should be to use the asset to support lending, which drives most asset productivity. The investment portfolio should be designed to promote and diversify loans.
The investment portfolio should be used to offset the portfolio’s liquidity, duration, convexity, and credit. The more illiquid, higher duration, and riskier the loan portfolio is, the more conservative and lower risk the bond portfolio should be. While productivity gets reduced within the securities portfolio, it increases in the loan portfolio, significantly impacting bank value. By using the investment portfolio to balance performance in lending, risk gets reduced or held constant with greater profitability for the bank.
The same goes for transaction accounts. Banks should help customers optimize their operating accounts to support their savings accounts (commercial and retail). In this manner, and like an investment portfolio, transaction accounts can be used to offset savings accounts’ risk (mostly liquidity). This optimization would result in greater bank AND customer value. This means that banks should invest more to provide analytics, insight, and functionality to help customers manage their cash flow and liquidity. Allowing customers to confidently move liquidity out of transaction accounts and into savings accounts would increase bank value over time.
Not all products are the same, just like not all customers are the same. By better-aligning capital investments with value creation, banks can improve performance.