According to the Bureau of Economic Analysis (BEA) US personal saving declined to an anemic 2.3% in October. The only time US personal saving has been this low was back in 2005 when it bottomed out at 2.1%.
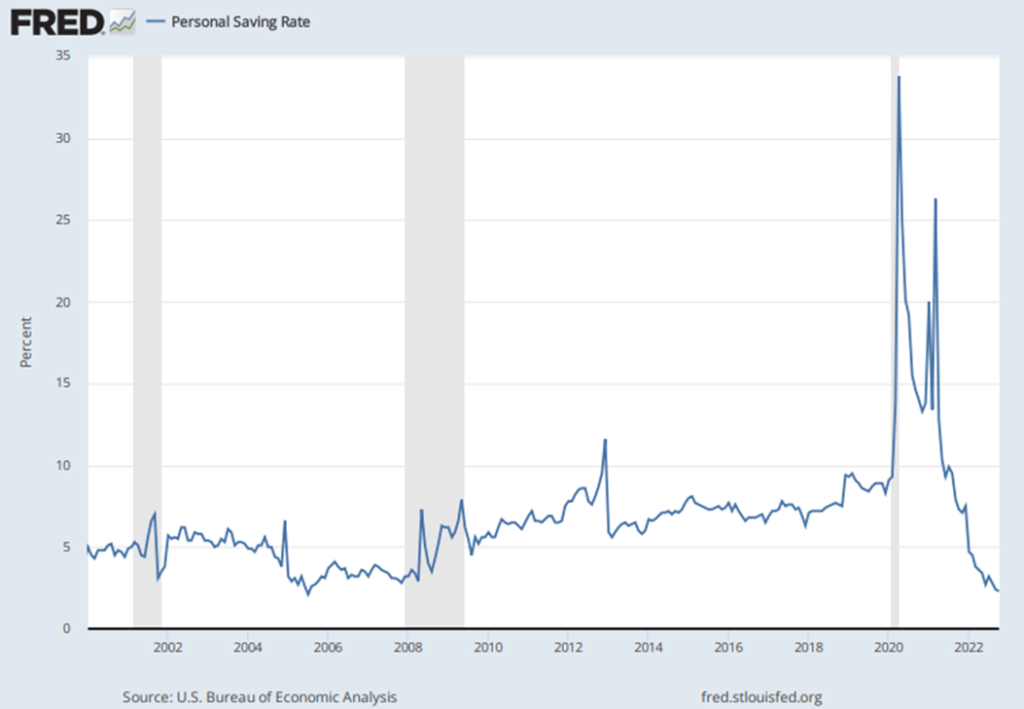
The US personal saving rate is the percentage of disposable personal income (DPI) that people are able to save. The BEA calculates the personal saving rate by subtracting taxes from personal income to arrive at “disposable personal income” and then subtracts personal outlays. What’s left is an estimate of personal savings.
While October’s US personal saving report raised a few eyebrows, it’s worth acknowledging that we’re living through a unique period in time. Rising geo-political tensions and pandemic-induced supply chain wrinkles are still being ironed out, resulting in historically higher inflation (rising costs) around the world. The impact of inflation has and will continue to contribute to the recent decline in personal savings, especially to the extent it continues to run above historic averages. At the same time, however, consumer spending rose 0.8% in October, a sign that people seemingly haven’t decided that now is the time to meaningfully dial back spending — even as the threat of recession looms. This is interesting because it’s largely in-line with the results of two recent studies by the US Federal Reserve Board (Report on the Economic Well-Being of U.S. Households in 2014) and another by the J.P. Morgan Chase institute (Weathering Volatility: Big Data on the Financial Ups and Downs of U.S. Individuals) which showed Americans tend to over-prioritize current consumption over savings, despite a lack of income growth and greater economic risks.
Even though this is something of an anomalous economic environment, Americans generally don’t have the reputation of being good savers, or at least as of late. Put another way, Americans seem to save too little, spend too much and borrow beyond their means. There was a time, however, when Americans did save more. From 1960-1989 personal saving averaged a relatively healthy 11%. From 1990-2019, US personal saving began to trend lower, averaging only 6.4% over that 30-year period.
While we used to save more, it’s worth pointing out that many of our international peers still save far more than we do. In fact, today we’re fairly low on the list of savers. As of October, the US ranked 32nd according to the Organization for Economic Co-operation and Development (OECD) data. At only 2.3%, the US trailed South Korea, which currently stands in first place with a personal saving rate of 34.2%. Going back to just before the distortions created by the pandemic, in 2019 the US ranked 15th, well behind China, Switzerland, Sweden, Mexico and Australia (1-5 respectively).
It’s well known that saving is a critical component of building wealth and fostering financial stability over time. Clearly, Americans don’t really seem to be as good at it anymore and this begs the question of why? Why don’t Americans save and why has personal saving declined over the last 30 years? The purpose of this blog post is not specifically to answer the question of “why?” but rather to generate meaningful thought about cultural and political shifts and how they shape our habits. With that in mind, I’m actually going to throw a few thoughts out there in the form of questions:
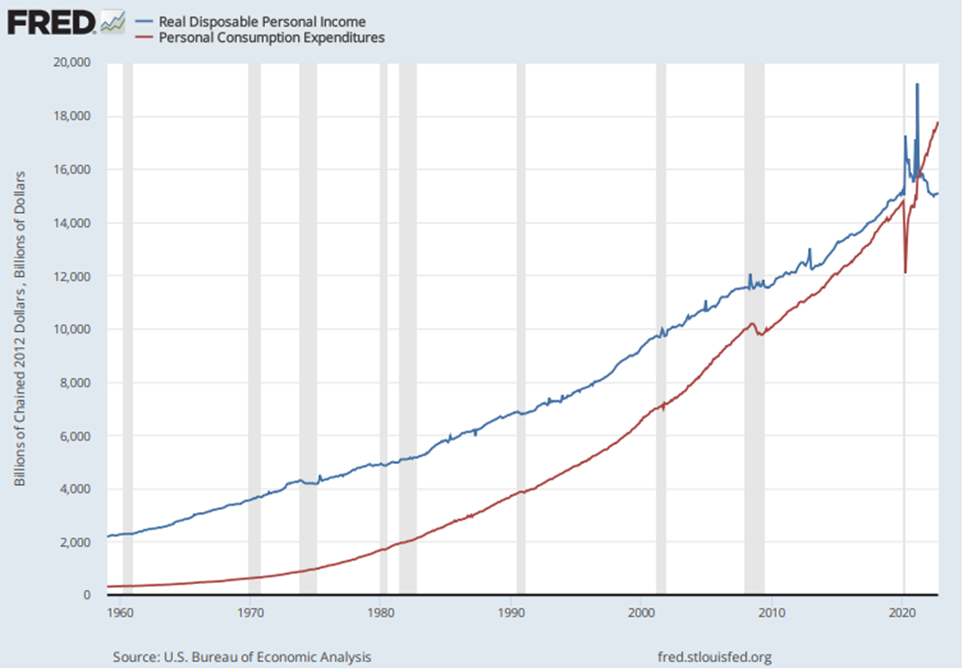
Observation:
From 1959 through roughly 1980, real disposable personal income exceeded spending by a significant margin and then began to narrow. From 1980 to 2020 (40 years) that margin narrowed significantly. Clearly over this 40-year period, Americans began to spend more on goods and services.
Did changes to policy encourage spending at the cost of saving?
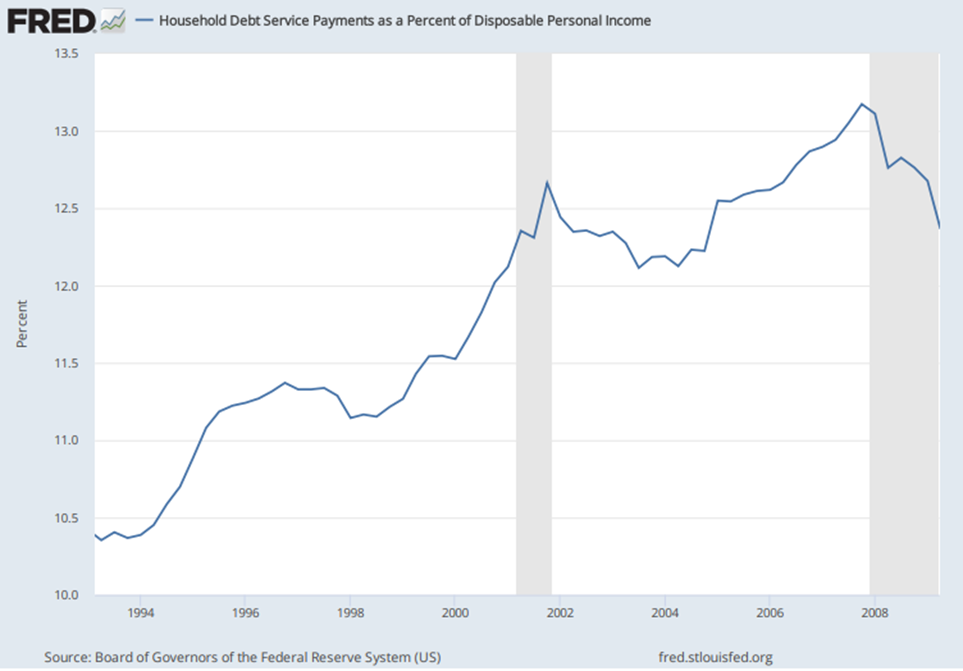
The1980’s was a period characterized by materialism and excess fueled by a decade of deregulation within the financial services sector. This deregulation allowed the financial services industry to begin to offer massive amounts of credit to the consumer on favorable terms. By the 1990’s, improvements in technology and further changes to securities regulations made it easier for corporate customers to access financial markets directly. This forced banks to renew their focus on middle market commercial banking and consumers. As such, the financial services industry made additional changes to both the housing and consumer credit markets in an effort to provide consumers with greater access to credit – including low income and minority families. These changes came in the form of more flexible underwriting standards, lower interest rates, fees, and down payments. As a result, and not surprisingly, household debt (consumer debt and mortgage loans) began to grow. From Q2 of 1993 through the end of 2007, household debt as a percentage of disposable personal income climbed by 26% to13.1%. As household debt ballooned, the costs associated with servicing it began to eat away at disposable personal income.
Of interest and contributing to the growth in household debt was an uptick in activity in two specific areas:
Home Ownership:
According to the US Census Bureau, the home ownership rate in the US averaged 64.4% from 1965-1990. From 1990-2004, US home ownership rose 7.45% to 69.2% and averaged 66% over that 14-year period. Adding to the observation is the fact that from roughly 2001-2006, a devastating housing price bubble formed due to lax lending standards. Recall the NINJA loans (No Income, No Job, Apply). According to the S&P/Case-Shiller US National Home Price Index, home prices rose a whopping 63% over that period (2001-2006) before beginning to crater heading into the Financial Crisis. What’s more is that the creation of the home equity loan, which for the most part didn’t exist until the mid-1980’s, helped turn American homes into ATMs – furthering the damage of the Financial Crisis.
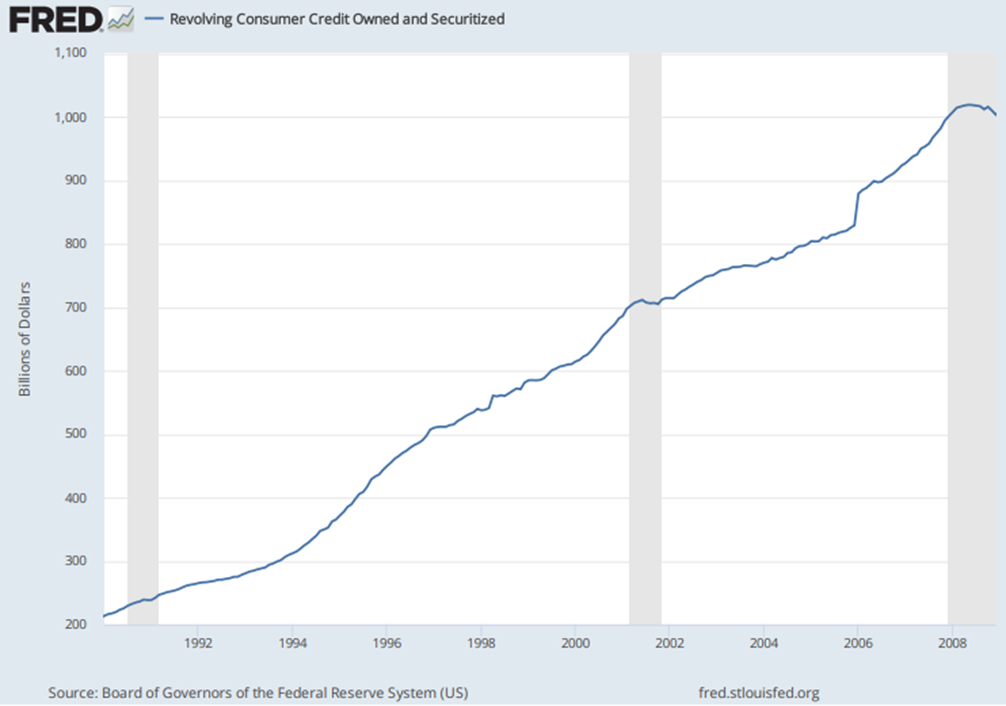
Revolving Credit (Credit Cards & Personal Lines of Credit):
While home ownership grew, revolving credit exploded. It expanded by 262% from 1990-2004 and by over 369% through 2008. While access to credit grew, the costs associated with managing it were high. According to Wallet Hub, the average credit interest rate of all credit card accounts averaged16.30% from 1991-2000.
Is consumerism in America cultural?
When most people think of American consumerism, their minds tend to drift back to the 1950s and the Eisenhower era. This was a period of time when the world was in the process of rebuilding from WWII. While the rest of the world was in the process of rebuilding, the Eisenhower administration stimulated the US economy through a combination of low taxes, spending and a balanced budget. What followed was a new level of prosperity. Relative to the rest of the word, things were good for the US consumer, really good. The US economy was on fire, unemployment was low, and Americans were able to spend. As such, this was arguably the time when many of the common stereotypes about the American consumer were born. Many of the iconic themes about materialism and excess were defined by pop culture (cars, clothes and money rolls) of the 80s, 90s and early 2000s. From this perspective it is easy to accept that American consumerism is cultural.
Is spending more important for the US economy than saving?
Cultural consumerism might be an easy answer, but consumer spending is also a necessity for the US economy. In fact, spending is often referred to as the engine of the US economy. After all, and as you’ve heard from us many times in the past, spending drives roughly two-thirds of US economic growth. Because of this, the government will often encourage consumerism through policy by punishing both savers (lowering interest rates) and investors (raising capital gains taxes). Case in point and in a relatively more recent example, following the Financial Crisis the Federal Reserve (FED) dropped rates to near zero and kept them there for a period of seven years (2009-2015) in an effort to stimulate the US economy. The results of this effort were mixed as much of this money actually made its way into the capital markets as many savers became investors in the search for yield.
Conclusion:
American’s seemingly growing inability to save appears to be combination of both cultural and policy driven factors. However, there is quite a lot to consider before arriving at the conclusion that the US has simply made it too easy to borrow and spend at the expense of saving. Could we see a reversal of this trend and perhaps a more balanced approached? It’s hard to say and largely depends on where our priorities are as we move forward. Perhaps that’s another question worth exploring: Just how bad it would be for the US economy if spenders became savers?
Washington Trust Bank believes that the information used in this study was obtained from reliable sources, but we do not guarantee its accuracy. Neither the information nor any opinion expressed constitutes a solicitation for business or a recommendation of the purchase or sale of securities or commodities.
Matthew Clarke, CIMA® is a Vice President and Senior Client Portfolio Manager for Washington Trust Bank’s Wealth Management & Advisory Services. Within the Portfolio Management Group, he works with a team of portfolio experts who analyze and coordinate strategies on behalf of our clients who require both a high level of customization and expert communication. Working with our Relationship Managers, Matthew represents a client-focused, comprehensive and disciplined approach to investment management that emphasizes our consideration to the client’s “big picture.” His active participation in our client relationships is instrumental for our continuous success in meeting their goals. Matthew has over 10 years of financial industry experience and is often called upon for investment strategies that support the sale of business, concentrated stock holdings and other financial events that require significant consideration and analysis.
![]() Links with this icon are leaving Washington Trust Bank's website. This link is provided as a courtesy. Washington Trust Bank does not endorse or control the content of third party websites.
Links with this icon are leaving Washington Trust Bank's website. This link is provided as a courtesy. Washington Trust Bank does not endorse or control the content of third party websites.
Home | Contact | Locations | Privacy Policy | Terms & Conditions | Safe Act Numbers | Posting Rules
Rates and fees subject to change. Entire contents: Copyright 2014 Washington Trust Bank. An Equal Opportunity Employer.


