Consumer Credit Update for 2Q 2023

If you were ever to pay attention to the consumer, the time is now. Even if your bank has limited consumer exposure, given that the consumer composes approximately 66% of the US economy, and, according to the yield curve and market pundits, we all could be staring into a recession. Paying close attention to consumer trends is critical. We recently met with TransUnion, one of the sharpest firms we know when it comes to consumer credit, along with a half-dozen banks, to uncover the data and insights into what the consumer is telling us. Below is our summary of the data and bullet-pointed insights.
General Trends & The Economy
- Short-term interest rates will remain at 5.60% for most of the year, and inflation will persist.
- Consumers still have extra disposable income, but it is decreasing. Savings will continue to increase.
- There is an increase in Chapter 12 & 13 bankruptcy over Chapters 7 & 11. This bankruptcy profile is a new trend not previously seen. This profile is likely a result of the jobs market being plentiful, with many households not qualifying for Chapter 7.
- Due to growing economic stress and higher rates, early retirees are returning to the market.
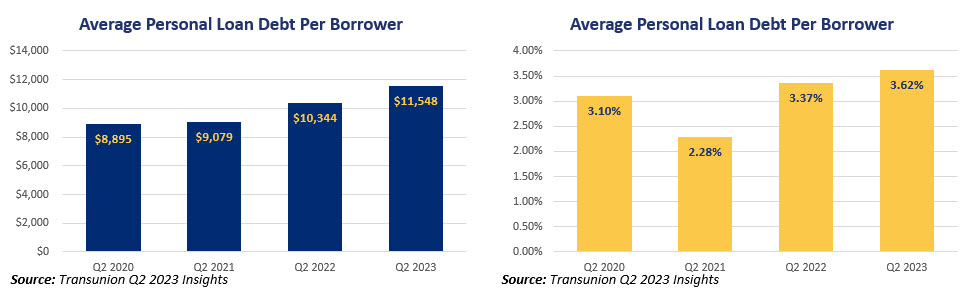
- Home equity lines of credit (HELOCs) and bank card usage are up 24% and 17%, respectively. These are cash flow management tools that send a signal of future problems. Unsecured personal loan usage is up 21%. This data is consistent across regions.
- The fact that charge-offs AND credit balances are increasing is a red flag.
- Many bankers agreed that the “roll” of credit delinquency volume, from 30, to 60 to 90 days and beyond, is often a harbinger of a forthcoming credit shock. We are starting to see this trend now.
- Lower-income households are still experiencing some form of wage growth protecting them.
Consumer Credit – Mortgage & HELOC
- Mortgage originations are down to the lowest level since 2005. There is a record low in rate/term refinancings.
- Volume is not expected to pick up in the second half of 2023. We should see a slight increase in production in 2025 and 2026 driven by lower rates. Refinanced loans will finish at 6% of volume and scream adverse selection (if you exclude life events). If you are refinancing now at higher rates, there is a higher probability of a forthcoming issue.
- Q2 was likely the top of home prices for this cycle.
- Tappable home equity remains high. 84% have availability, with the median available of $242k. 5.3% record of households have more than $1M in equity. These factors bode well for credit.
- Fixed-rate second mortgages have been in demand (primarily driven by the lenders’ marketing), and origination has increased. Most banks are around 50%/50%, but some are 70%/30% of fixed second trust deed mortgages over first lien HELOCS.
- If you are not controlling the distribution of the proceeds, you should unless you are sure the consumer can handle the higher debt load. If the stated purpose of the loan is to pay down higher-priced debt, banks should maintain some control to ensure the consumer ends up in a better position than pre-loan. Unfortunately, the last downturn taught many consumers to use debt consolidation mortgage loans to increase their debt load.
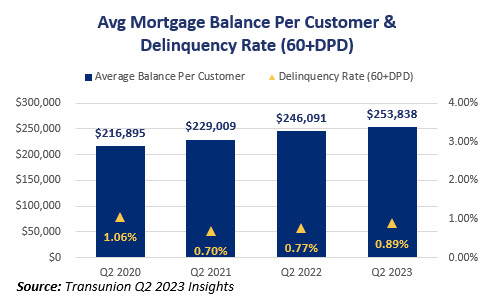
- Roll Rates are increasing – 36% to 43% for 60-day delinquencies going to 90 days. These roll rates are a red flag and should impact bank delinquency models. Offsetting this risk is the fact that delinquencies remain at historically low levels relative to job market strength, the higher than average equity that is built up in homes, and the fact that there is a higher than average percentage of consumers above a 760 credit score.
- Strength in the job market plus a percentage of fixed rate loans are supporting models and different than in the past. The recent shift to the higher adjustable-rate mortgages (ARM) mix remains a problem and negatively impacts predicted credit performance. ARM resets will hurt many banks in terms of credit beyond what their models/projections show.
- New, post-2008 underwriting guidelines are having a positive effect on credit.
Consumer Credit – Auto Loan
- The lack of inventory, higher rates, and higher prices present a confluence of events that we have not seen before and are likely to cause greater bank model inaccuracy. New inventory normalization should help originations. We have likely seen the peak of new and used car prices.
- The shift to EV/hybrid cars hides some price drops due to the mix change.
- We are seeing the lowest origination totals since 2013. That said, the “super-prime” segment is still increasing.
- Only 8% of new cars have a price point below $30k, which used to be 38%. This price distribution is causing some bank model inaccuracy. $1,000+ payments now are 15% of the market which is also a new development. The average payment is $734/month for new and $534/month for used. This is up 8% and 3%, respectively. 87% of loans are above a 6% rate.
- The trend of increasing terms has slowed, and the average term has been reduced. There has been less supply of 10Y paper. The difference in new vs. used terms is now less than two months – another industry first.
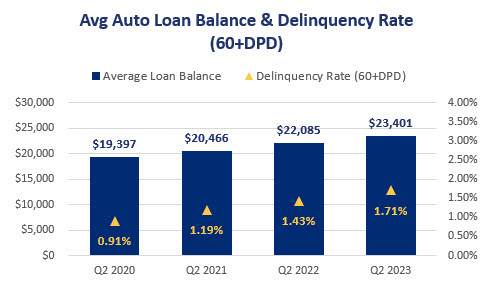
- Loan-to-value (LTV) is up 8.6% for used cars YoY. LTV is down for new cars at -3% YoY. As of 2Q 2023, LTVs for used cars are at 123, while new cars are at 103. LTVs remain at elevated levels and slightly above the last record of 2008. What is different now is elevated auto prices.
- Banks are currently reducing indirect auto financing growth and are managed by greater holdback and fewer exceptions. Some of this is due to margin pressures. There is more bank interest in direct origination.
- Capital rotation is to HELOCs and away from autos. Within autos, the capital rotation is for new cars over used cars.
- Nominal margins remain healthy, but risk-adjusted margins decrease due to elevated risk. Shorter terms partially offset higher payment risk.
- Pricing remains the primary lever to slow originations for most banks. Banks are targeting 20% to 40% lower auto volume from last year.
Consumer Credit – Cards
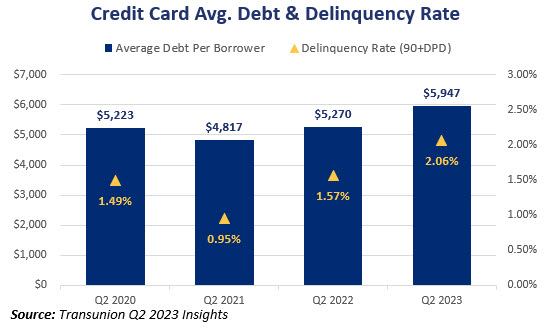
- Originations have declined in the past two quarters but remain significantly elevated in long-term comparisons. The Q1 2023 total of 19M was the highest Q1 total on record. The easing of originations in the past two quarters is due to reduced volume in the below prime tiers, particularly for subprime (which has reduced from 24% to 18% of originations in the past year). There is a shift of capital occurring to the prime tiers of cardholders. Balances are up, driven by inflation. Per card balances are spiking but below 2008, meaning more cards are in everyone’s wallet.
- The number of cards in the wallet is almost a full card at just shy of 3.
- Consumers are going through a revaluation valuing more retail products over travel products (i.e., “restaging their wallet”).
- Open to buy/credit strategy & closures – Due to usage patterns, this is an ideal time to clean up dormant/inactive cards. There is a record number of 18+ month dormant accounts.
- Gen Z and Millennials are now using credit on their cards which was not seen before 2020. This usage results from “coming-of-age” trends, but some of this trend is due to lower savings rates. It is important to note that this trend does not include Buy Now and Pay Later (BNPL ) credit which is likely to make credit risk worse than it appears.
- All risk tiers are trending above pre-pandemic levels in terms of credit exposure.
- Utilization has increased to 22% but materially below the 27% spike in 2010. The increase in utilization has occurred faster (i.e., the rate of increase is greater) than the 2007/2008 experience. This is a potential red flag.
- The average consumer has just over $28k for a credit limit. Subprime is $3,800.
- Cure rates have come down, and roll-forward rates have increased, which doesn’t bode well for the future. The recent vintage is performing weaker than in previous years.
- We have never seen an increase in the rate of growth in delinquencies across all vintages (usually just in the most current vintages). This is likely a reversion to the mean from depressed delinquency levels but is worth monitoring.
Consumer Credit – Student Loans
The CARES Act and subsequent administrative actions paused the required payment for more than 25M student loan borrowers for more than two years. This suspension is scheduled to end later this year, and the question is now how the current rise in rates, the current economy, and the economic outlook will impact student loan credit. Last year’s Consumer Financial Protection Bureau (CFPB) study showed that 15M borrowers have at least one credit red flag and 5M borrowers have two. These risk factors, combined with the forbearance and now higher rates, present a potential problem for the US economy and banks that finance the debt.
For insight, we turn to the TransUnion shock model. Here, TransUnion removes loans in forbearance, private loans, and all loans expecting payment or on current deferral. These adjustments result in a total of 27M borrowers for $1.1T of outstanding exposure. From this model, we see the following insights:
- We are seeing greater use of consumer debt vs. student loans than in the past.
- Non-mortgage student loan borrowers should experience a 55% payment increase due to rates ($336/Mo average). Student loan borrowers that are also mortgage holders will go through a 15% increase in the minimum payment due ($401 average). It is important to note that rent is not included in the non-mortgage calculation, so the effective shock percentage is even greater once factored into the equation.
- Ability to Pay (AtP) – 10% of borrowers now have at least one delinquency (mostly on card or unsecured loan). Aggregate Excess Payment (AEP) – 78% are making current excess payments (follows credit quality with subprime having lower AEP). After the rate increases, AEP will drop to 51%. It is the other 50% that are at risk that banks should focus on. This is 83% of sub-prime borrowers and 56% of near-prime. Banks need to know AEP and understand segmentation by credit tier to be an effective manager of credit. Banks should put management plans in place now.
- 48.6% of student loan borrowers in this segment will likely see their AEP drop into the $0 category once the student loan payment shock is applied. These consumers will have difficulty meeting their current payment obligations and have a high likelihood of delinquency. It is important to note here that this population is not strictly made up of below-prime borrowers. For example, roughly 21% of super prime consumers are forecasted to have $0 AEP once the rate shock occurs.
- Other actions – reassess the ability of borrowers to pay debt, increase portfolio reviews, and incorporate other predictive data elements.
- Update pre-delinquency treatment and make outreach sooner rather than later. The act of outreach alone will increase payment performance.
- Balances will go up as borrowers become stressed, so portfolio/collection/marketing routines should be put in place to prevent negative credit migration.
- The big issue is that these trends are taking place going into the holidays. The increase in debt caused by the holidays will elevate the credit risk for lenders.
- Student loan borrowers are more likely to be delinquent on unsecured debt due to the reset-up in rates.
- The payment requirement hits in Sept. but has not been reported for a year. Thus, banks are at risk due to this lack of transparency (The federal government will not allow non-payment reporting until next year). Look for borrowers to take advantage of this reporting lag. There are issues with Fair Lending around trying to mitigate this risk, so banks are cautioned to proceed with counsel and risk review.
Putting This Into Action
One major takeaway is the realization that consumer credit scores are not what they seem. The data paints the picture that while the consumer is starting at a better position than before the 2008 downturn, we are seeing a faster elevation of risk than before. Banks should consider their underwriting, pricing structure, and resource allocation based on credit scores.
While the predictive power of credit scores remains strong, some of the credit bands have shifted due to the environment. This shift is on the order of some 30 to 45 points. A TransUnion Study (HERE) published last month found that credit scores inflated during the pandemic due to government assistance, lower credit usage, and loan forbearance offerings. Now, some of these consumers that migrated up in score are becoming delinquent on their credit obligations at higher rates than historical trends suggest.
Thus, if your bank targets a minimum 680 score, that target may need to move to 715 to predict the same performance. This move is critical as many banks have not adjusted their underwriting and pricing tiers. This risk adjustment could also have some material volume implications. For some banks, increasing the minimum credit score and target median means a 40% reduction in origination volume going forward.
In a future article, we will discuss how the current credit trends scream for banks to leverage their data and analytics to segment their customer base to get more accurate on the allocation of capital. We will discuss how banks can purchase third-party data and combine it with on-us data to get a more accurate picture of their consumer borrower.
While it is not a foregone conclusion that we are heading into a recession, proactive banks will use this time to prepare their borrowers better and adjust their originations to limit problems in the future. With a little effort now, a tremendous amount of capital might be saved.