Forecasting Cost of Funds Given Fed Moves

Based on the futures market, the Federal Reserve is expected to raise the Fed Funds rate to 3.00% at its December 2022 meeting. The Fed will also aggressively shrink its balance sheet to tame unwanted inflation. These two Fed moves, along with the economic environment and customer behavior will impact your forecasting of your cost of funds. In this article, we analyze the industry’s cost of funding earning assets (COF) and track how community banks’ COF behaves relative to larger banks. The insight will inform you about the current value of your deposit base and help you prepare for an environment where deposits are dear again. In future articles, we will explain our modeling for community banks’ COF based on inflation, Fed Funds rates, consumer consumption and the Fed’s balance sheet runoff.
Historical Cost of Funds Analysis
While we have covered the impact of the Fed on lending (HERE), we want to focus on the liability side of the balance sheet.
We examine the roughly four thousand FDIC-insured commercial banks and S&L associations over the last four decades. Financial institutions’ COF behavior is similar across asset sizes. The correlation coefficient between the industry’s COF and short-term rates (LIBOR, Prime, SOFR, Fed Funds) is in the mid-’90s, as shown in the graph below. The industry’s lag between short-term rates and COF is approximately six months.
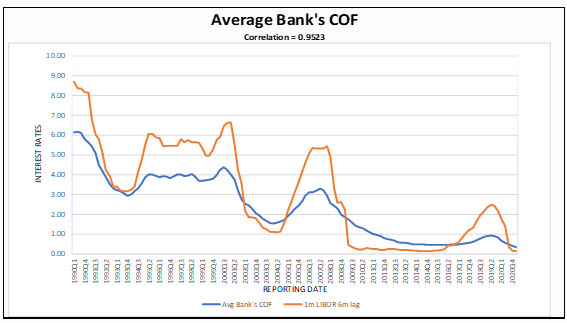
However, correlation is not causation, and different banks will exhibit different COF behavior and terminal COF depending on various macro-economic factors and business strategies.
Future Short-term Rates
Community banks’ projected COF will be primarily affected by the path and pace of future short-term interest rates. How fast rates rise, for how long, and the terminal Fed Funds rate will all impact the industry’s COF. The graph below is from the CME Group’s FedWatch tool and shows the market’s expectation of the target Fed Funds rate for the July 2023 meeting. While the expected rate is 3.25 – 3.50%, the market sees a substantial probability of both higher and lower rates.
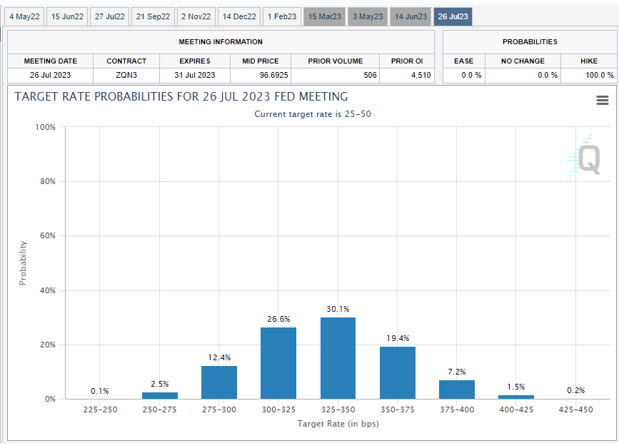
Faster rate hikes, a longer hiking cycle, and a higher terminal rate would be unwelcome outcomes for the industry’s COF.
Forecasting Cost of Funds Given the Fed’s Balance Sheet
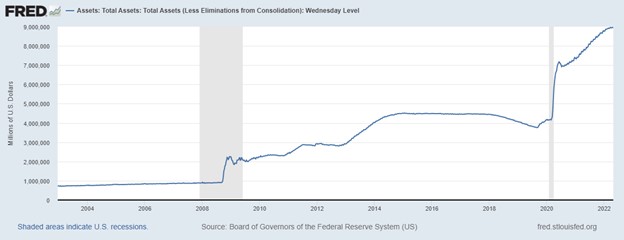
The graph below shows that the Federal Reserve’s balance sheet stands at just under $9T, and almost $5T of these assets were added post-pandemic.
The balance sheet mechanics of a Fed’s runoff requires some review as it will lay part of the basis when forecasting your cost of funds. The Fed’s balance sheet decreases when the Fed sells Treasury securities or does not reinvest the proceeds of its maturing Treasuries. An example of the balance sheet runoff for the Fed, banking industry, and public/money market funds appears below.
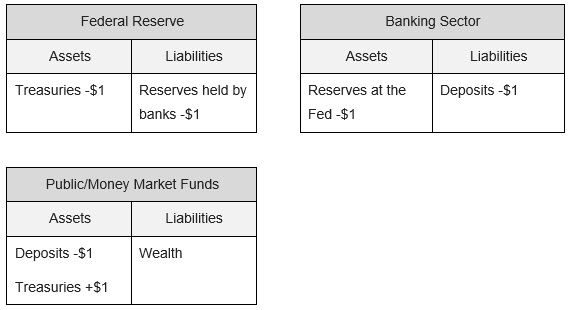
The impact of the Fed not reinvesting $1 of maturing Treasuries is that reserves by banks held at the Fed decrease by $1, deposits at banks decrease by $1, and the public/money market funds (or some other buyer) purchases the $1 of Treasuries by decreasing deposits by $1.
At the writing of this article, the market continues to wait for the announcement of the Fed’s pace for balance sheet runoff but we project that the Fed will likely reduce their balance sheet by between $50B and $95B per month starting in June depending on the strength of the economy and impact of rising rates.
That likely means that approximately $500B will run off this year and likely over a trillion dollars next year. While no one knows for sure how this will impact yields, we estimate that every trillion dollars of asset sales/maturities will increase yields in the intermediate part of the curve by approximately 10 to 20 basis points. Assuming the Fed lets $3T run off before it gets nervous and pauses, that is an impact of approximately 30 basis points in addition to the raise in the target rates over the next three years.
How to Apply The Fed’s Balance Sheet Moves To Forecast Your Cost of Funds
The impact of rising interest rates and a shrinking Fed balance sheet is very real to all financial institutions. Still, it does not in itself allow us to predict the general pattern of rising deposit costs when interest rates climb because deposit-taking institutions have the ability to lag their deposit rates to Fed Funds. They also can pass along less than the full rise in interest rates to depositors. In fact, some accounts at banks are non-interest bearing, and those accounts arguably are interest-rate insensitive (betas of zero).
Deposit betas are unique to each bank based on the deposit franchise of the institution. Banks with a large number of small-balance DDAs may experience a low beta, while online consumer banks such as Capital One and American Express may demonstrate very high betas and short lags.
We will consider what strategies banks deploy to lag short-term interest increases and depress their deposit betas in a future article. We will also consider the nature of online competition for deposits, the rate consumers are eroding their savings due to post-pandemic purchasing combined with higher inflation and then model the industry’s expected course of COF based on the Federal Reserve’s expected monetary strategy. This information will not only help you determine the current value of deposits and help in forecasting your cost of funds, but will lead to strategies on how you can decrease your sensitivity to deposit run off and higher deposit rates.